| Corcoran Technical Trading Patterns For April 1 |
| By Clive Corcoran |
Published
03/31/2009
|
Stocks
|
Unrated
|
|
|
|
Corcoran Technical Trading Patterns For April 1
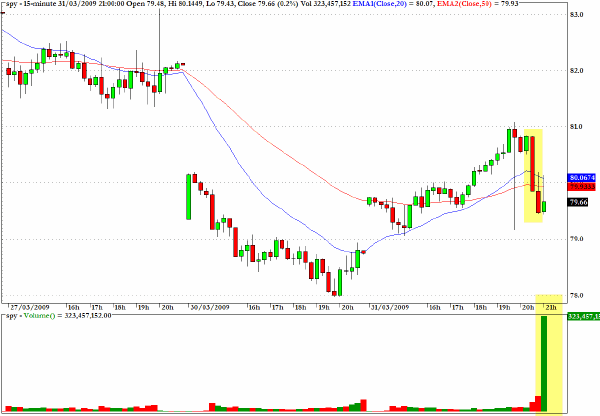
The SPY proxy shows a rather strikingly large volume spike on the close yesterday. The 15-minute chart displays the gradual recovery pattern that emerged during the session and the abrupt selloff which kicked in during the final hour of trading which brought the index down from its attempt to close the opening gap that arose at the commencement of Monday's trading.
The cash index closed at 797 which is just above the 38% retracement level (795) I have discussed here recently and the near-term direction, given the uncertainty of the G20 discussions and Friday's employment data, would seem to be one of tentative testing of the region between 780 and 820.
Watching the BBC World News last evening with live coverage of the arrival of Air Force One at Stansted Airport in the UK, I have to admit to being impressed by the timing and precision of the President's itinerary
After leaving the 747, President Obama and his wife, who looked very chic in a well chosen outfit, had to walk no more than 100 yards to the Marine One helicopter which took them on the twenty-minute flight into central London.
What crossed my mind as I watched is how it is always important to create a good impression, adorned in all one's finery with all of the pomp and circumstance in evidence, when one is about to meet with one's bankers.
As one commentator said, this meeting in London is really a G2 meeting between the US and China with lots of little countries invited to make up the numbers.
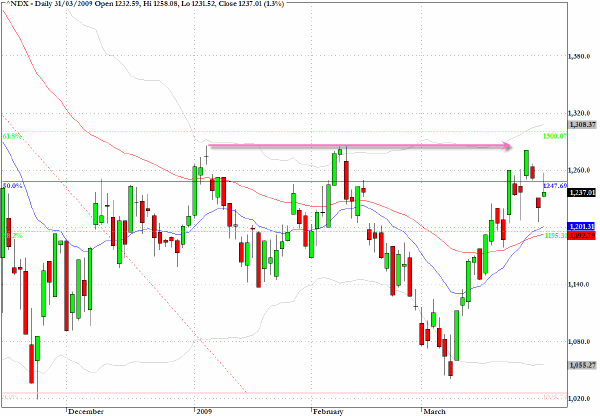
The Nasdaq 100 Index (NDX) is the most bullish of the major US equity indices and the close yesterday shows that within the fibonacci grid super-imposed on recent price action the index is now very close to key 50% level around 1250.
A test of the 62% level at 1300 seems to be a feasible target in the near term but this could also coincide with overall market choppiness.
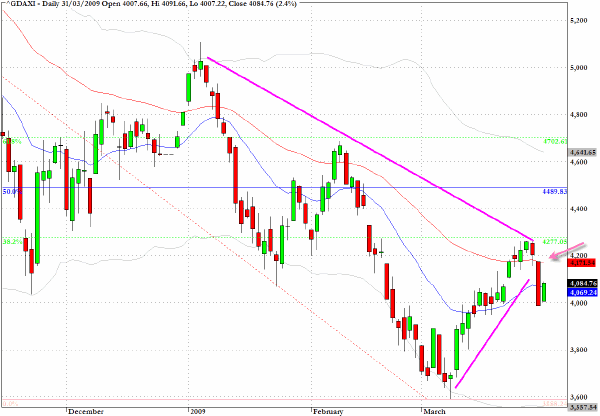
Within European trading yesterday the FTSE was the standout performer with a 4% plus gain while the DAX in Germany could only manage a two percent gain.
The DAX faces a real test between 4200 and 4300 and this index has almost ten percent further to go towards the 50% retracement level from the strategic high and low of the last few months.
Underperformance of the DAX reflects the particular weakness of the domestic manufacturing sector and also could be a symptom of a less expansionary fiscal policy on the part of German Chancellor Merkel who will be presenting the case for more caution on stimulus measures at the G20 gathering.
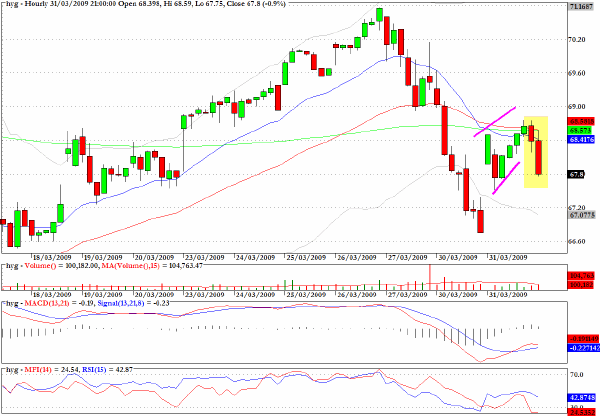
As featured in the column yesterday, HYG, one perspective on the high-yield corporate bond market, performed somewhat in harmony with equities but as the hourly chart reveals the sector dropped abruptly after running into resistance at the convergence of all three moving averages.
The pattern also exemplifies a well defined bear flag formation on the hourly chart which suggests that the sector remains vulnerable to further downside price action.
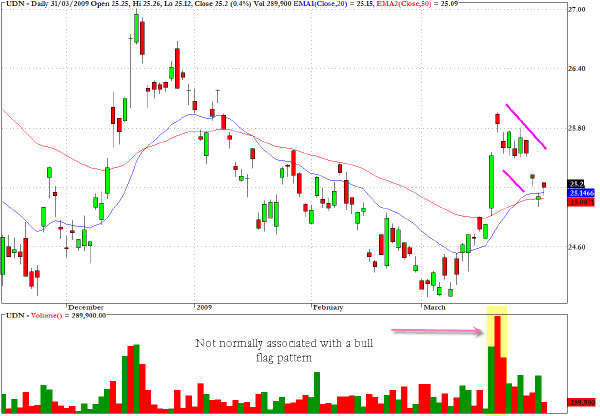
UDN, which enables one to be long and have a positive payoff if the US Dollar index declines, has an apparent bull flag (i.e. suggesting that the dollar is headed downwards). However, as annotated on the chart below, the heavy volume red bar is not entirely consistent with the pattern's characteristics and this would keep me on the sidelines at present.
Clive Corcoran is the publisher of TradeWithForm.com, which provides daily analysis and commentary on the US stock market. He specializes in market neutral investing and and is currently working on a book about the benefits of trading with long/short strategies, which is scheduled for publication later this year.
Disclaimer
The purpose of this article is to offer you the chance to review the trading methodology, risk reduction strategies and portfolio construction techniques described at tradewithform.com. There is no guarantee that the trading strategies advocated will be profitable. Moreover, there is a risk that following these strategies will lead to loss of capital. Past results are no guarantee of future results. Trading stocks and CFD's can yield large rewards, but also has large potential risks. Trading with leverage can be especially risky. You should be fully aware of the risks of trading in the capital markets. You are strongly advised not to trade with capital.
|