| The Wagner Daily ETF Report For April 1 |
| By Deron Wagner |
Published
03/31/2009
|
Stocks
|
Unrated
|
|
|
|
The Wagner Daily ETF Report For April 1
Stocks wrapped up the first quarter of 2009 with a solid session of gains, enabling the main stock market indexes to reclaim their 50-day moving averages. The broad market gapped higher on the open, then trended higher in the afternoon, but selling pressure in the final thirty minutes of trading caused stocks to surrender a large portion of the day's gains. The Nasdaq Composite advanced 1.8%, the S&P 500 1.3%, and the Dow Jones Industrial Average 1.2%. The small-cap Russell 2000 and S&P Midcap 400 indices posted identical gains of 1.6%. All the major indices closed just above the middle of their intraday ranges.
Turnover rose across the board, enabling both the S&P and Nasdaq to register a bullish "accumulation day." Total volume in the NYSE ticked 9% higher, while volume in the Nasdaq increased 6% above the previous day's level. Considering the S&P sold off on higher volume on Monday, it was bullish that the index followed up with a session of even higher volume gains. Nevertheless, we remain on the lookout for the presence of additional "distribution days" that could put the current rally in danger.
In yesterday morning's commentary, we said it would be important to see whether or not the S&P and Dow were able to quickly snap back above their 50-day moving averages, as well as their previous day's highs. Both indices indeed moved back above their 50-day moving averages, but failed to finish above their previous day's highs. The Nasdaq marginally closed above Monday's high, but the late-day selloff caused the index to form a bearish "inverted hammer" candlestick on the daily chart.
In the short-term, we're now seeing mixed signals in the broad market. Leading individual stocks have generally performed better than the broad market over the past two days, which is bullish. It's also positive that the S&P and Dow snapped back above their 50-day moving averages, after testing that new support level in the preceding day. Conversely, the bearish argument is that stocks now must contend with a plethora of overhead supply from the mid-January to mid-February levels. There also remains a clear lack of sector leadership. Overall, we believe these mixed signals are pointing to the likelihood of a period of sideways consolidation over the next one to three weeks.
Though a period of sideways consolidation typically presents limited trade opportunities, it would actually be beneficial for the intermediate to long-term health of the broad market. Because stocks ripped off their March lows so rapidly, a multi-week period of range-bound trading (aka "correction by time") would allow the 20 and 50-day moving averages to rise up closer to meeting the prices of stocks that just made huge runs off their lows. If stocks subsequently go on to make another leg up, those bases of consolidation would decrease the odds of the breakouts failing, thereby creating greater opportunities for profit several weeks out.
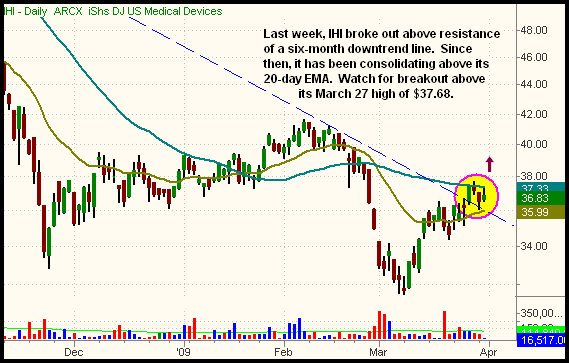
If the major indices settle into a sideways range for a few weeks, it will create new ETF buy setups that would otherwise not have been that solid. This is because markets that rise too fast have a tendency to reverse lower just as quickly. As such, we're actually pleased about the possibility of stocks catching their collective breath, as fresh buying opportunities should emerge. So far, one such ETF we're adding to our watchlist for potential breakout in the near-term is iShares Medical Devices (IHI):

Since recovering off its March low, IHI has been drifting higher for the past two weeks, holding support of its 20-day exponential moving average (the beige line). Last week, it broke out above resistance of a six-month downtrend line. Then, a few days ago, IHI ran into resistance of its 50-day MA (the teal line), and was unable to break out above it on the first attempt. But with the trading range tightening up, and the 20-day EMA rising up to meet the price of the 50-day MA, we think IHI has strong potential for an upside breakout within the next week, thereby potentially leading the major indices on another leg higher. Our projected buy entry into IHI is just above the March 27 high of $37.68, which also correlates to a confirmed breakout above the 50-day MA. Stay tuned throughout the rest of the week, as we will analyze additional ETF setups as they present themselves.
Open ETF positions:
Long - USO, UGA, SLV, UDN, HHH, TAN
Short - (none)
Deron Wagner is the Founder and Head Trader of both Morpheus Capital LP, a U.S. hedge fund, and Morpheus Trading Group, a trader education firm launched in 2001 that provides daily technical analysis of the leading ETFs and stocks. For a free trial to the full version of The Wagner Daily or to learn about Wagner's other services, visit MorpheusTrading.com or send an e-mail to deron@morpheustrading.com.
|