| Corcoran Technical Trading Patterns For April 2 |
| By Clive Corcoran |
Published
04/2/2009
|
Stocks
|
Unrated
|
|
|
|
Corcoran Technical Trading Patterns For April 2
Markets have rallied strongly on Thursday - with the Hang Seng as the standout performer with a 7.4% gain. Several factors are being cited for the move (although the technical conditions were also constructive after retreats to key support levels especially in Hong Kong). There are certain signs that in the US the economy may be bottoming and even in key markets which entered recession later than the US there are signs that the downturn is not getting worse - at least those of a more cheerful disposition are claiming to see them. The G20 has not (yet) disappointed with a major disagreement and there are perceived to be positive implications from the possible mark to market (M2M) deliberations to be announced in the US today.
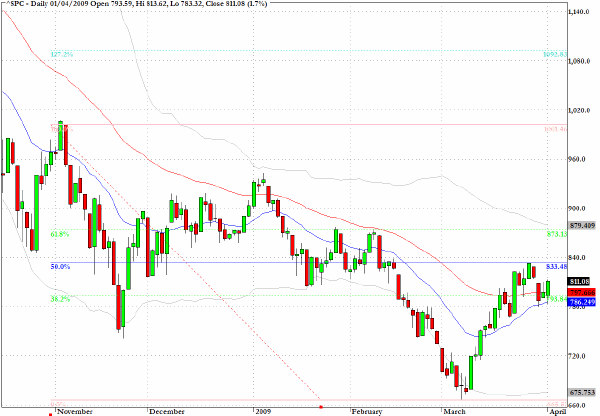
The S&P 500 seems certain to head back to 835 today and who knows with some real aggressive action by the bulls we could start moving to the next major testing zone around 875.
As this is being written the G20 world leaders are trying to thrash out the best communique for release later this afternoon (London time).
Some thoughts on the G20 from yesterday’s blog:
There has been a lot of commentary on whether Nicolas Sarkozy’s threat to walk out of the G20 summit is just "grandstanding" for his domestic constituents or whether it reflects a more serious threat.
Frankly it seems rather dubious whether even a united G20 communique amounts to a whole lot but there are important precedents to the French distaste for Anglo-Saxon finance.
In the 1960’s Charles de Gaulle was constantly banging heads with the British and the Americans on their financial prudence. The following article from the archives of Time magazine in 1965 gives the flavor of these disputes and is especially relevant in the context of the current discussions about a new foundation for a global reserve currency.
My own view is that the suspicions about the integrity of the US dollar are not going to be easily appeased and even if there is no serious debate about the matter at the G20 summit in London tomorrow this issue is not going away.
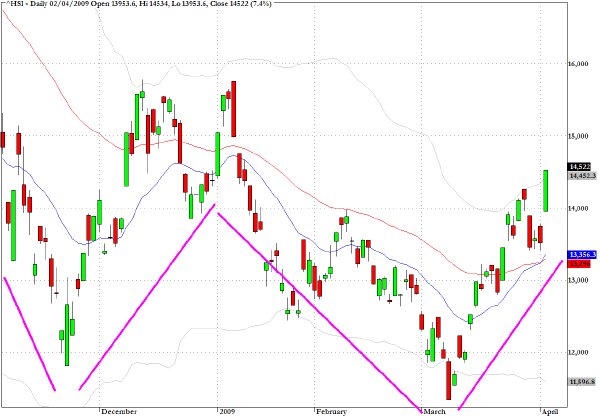
The Hang Seng Index in Hong Kong posted a 7.4% gain in Asian trading on Thursday. It has made a very strong recovery since late last week and, as anticipated, found support close to the intersection of two key moving averages - the 20 and 50-day EMA.
The interesting chart configuration which is developing is of a slightly downward slanting W formation which could be pointing to the fact that the tone of the market in coming months could be one of further fits and starts - but with a sideways bias.
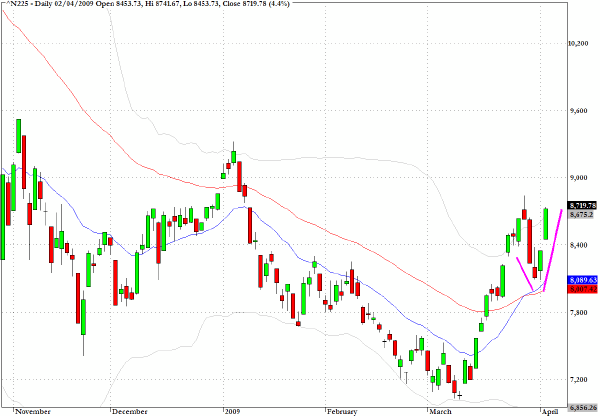
The Nikkei 225 joined in the merriment on Thursday and notched up a 4.4% gain.
The chart shows that the index will face strong overhead resistance at the early January high around the 9200 level.
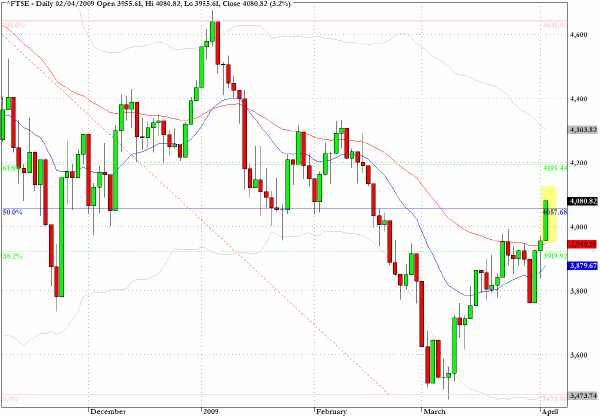
European equity investors are showing plenty of enthusiasm in trading on Thursday morning. The UK’s FTSE index has made a rather striking reversal over the last few sessions.
Just last Thursday the index dropped sharply to the 3760 level but with a 3% plus move already in place today the index could well be on course for its first close above the 50% retracement level from strategic highs and lows observed over the last several months.
The swing high has been chosen as 4640 which was a key level in early November 2008 and also marked the top after the end of year/early January level and the swing intraday low was taken as 3564 seen on March 9.
The next probable target for the bulls would be the 4200 level but I would not expect us to slice through that without a struggle.
Traders in the UK seem to have been cheered by reports from the Nationwide Building Society showing that for the first time in 16 months there was an increase in home prices. Now the guessing game is going to be how much have markets already discounted of the first green shoots since their moves off the March lows?
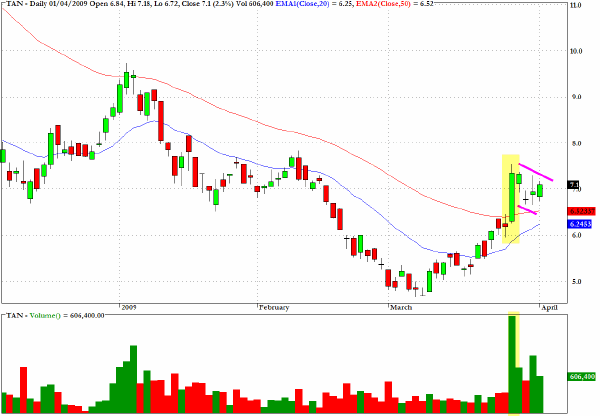
I will be looking for an entry point on the long side for TAN, an exchange traded fund which tracks the Global Solar Energy Index.
There is a very well defined bull flag and this sector fund could be headed back towards $9.
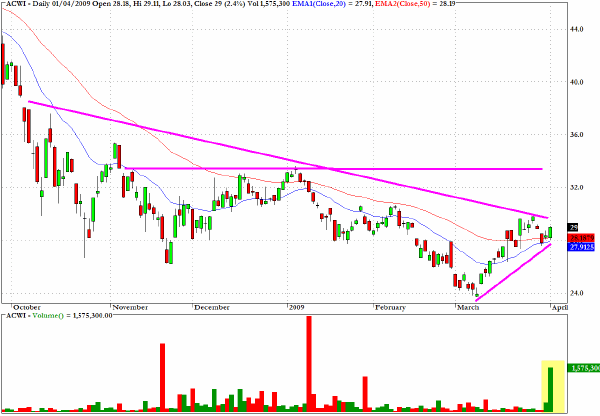
The investment vehicle which tracks the iShares MSCI ACWI Index is pointing towards a potential in today’s session for a break above a major downward trendline through the highs extending back into last year.
Also notable was the very large volume that came into the market yesterday suggesting that some of the larger funds are placing bets that the economic recovery story is gathering momentum.
As suggested by the chart annotations, the $33-34 area would be a target if you are feeling optimistic and adventurous about the beginnings of recovery in the emerging markets.
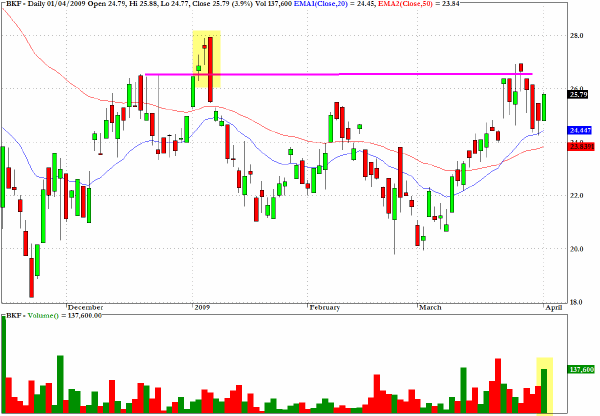
The MSCI Bric fund, BKF, also saw above average volume yesterday but, in line with some other indices discussed, the fund faces a key challenge at $28 - the early January high.
Clive Corcoran is the publisher of TradeWithForm.com, which provides daily analysis and commentary on the US stock market. He specializes in market neutral investing and and is currently working on a book about the benefits of trading with long/short strategies, which is scheduled for publication later this year.
Disclaimer
The purpose of this article is to offer you the chance to review the trading methodology, risk reduction strategies and portfolio construction techniques described at tradewithform.com. There is no guarantee that the trading strategies advocated will be profitable. Moreover, there is a risk that following these strategies will lead to loss of capital. Past results are no guarantee of future results. Trading stocks and CFD's can yield large rewards, but also has large potential risks. Trading with leverage can be especially risky. You should be fully aware of the risks of trading in the capital markets. You are strongly advised not to trade with capital.
|