| The Wagner Daily ETF Report For April 2 |
| By Deron Wagner |
Published
04/2/2009
|
Stocks
|
Unrated
|
|
|
|
The Wagner Daily ETF Report For April 2
With an increasingly more frequent display of resilience, stocks reversed early losses yesterday morning, finishing the day firmly higher across the board. The main stock market indexes opened more than one percent lower, but the bulls quickly stepped up to the plate, enabling stocks to settle into an upward trend throughout the rest of the day. The Dow Jones Industrial Average opened 1.6% lower, but rallied more than 3% intraday, finishing with a closing gain of 2.0%. Shaking off similar early losses, the S&P 500 and Nasdaq reversed to gain 1.7% and 1.5% respectively. Small and mid-cap stocks failed to show leadership this time. The Russell 2000 climbed 1.5%, but the S&P Midcap 400 advanced just 1.1%. All the major indices closed near their best levels of the day.
Total volume in the Nasdaq increased 6% above the previous day's level, enabling the index to record its second straight "accumulation day." Turnover in the NYSE, however, was 8% lighter. With only one day of higher volume losses ("distribution day") in recent weeks, and the presence of several sessions of higher volume gains, the Nasdaq is gradually looking more bullish "under the hood." The volume patterns in the NYSE have also been improving, but the S&P 500 has had two "distribution days," and a few less "accumulation days." This volume analysis tells us, without even looking at a chart, that the Nasdaq remains stronger than the S&P and Dow. This same analysis last month is the reason we bought (and later sold for a large gain) a broad-based Nasdaq ETF (QLD), rather than an ETF that tracks the S&P or Dow.
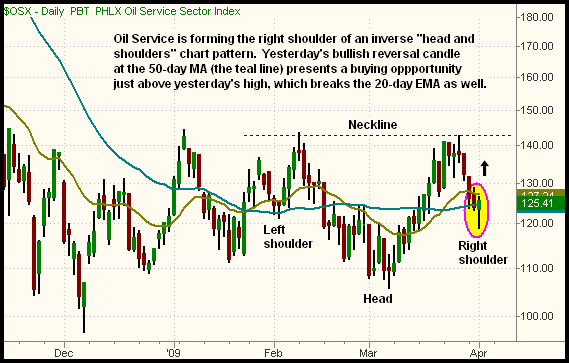
Over the next several days, the current chart pattern of the Oil Service Sector ($OSX) may present buying opportunities in select Energy ETFs. We've annotated the daily chart of the $OSX Index below:

There are several reasons we like the chart of the $OSX Index right now. First, the index is forming the right shoulder of an inverse "head and shoulders," a bullish chart pattern. Second, the $OSX corrected down to support of its 50-day MA this week, then formed a bullish reversal candle yesterday. The intraday probe below the 50-day MA is bullish because it washes out the "weak hands." A rally above yesterday's high, in today's session, should send the index on its way to breaking out above the neckline. If it does, follow-through in the inverse head and shoulders pattern could send the $OSX sharply higher.
If the $OSX Index shows strength in the coming days, the corresponding ETF with the most similar chart pattern is Oil Service HOLDR (OIH). However, there are several other Energy ETFs that are also poised to make another leg higher after pulling back this week. Here are a few others to consider, depending on which shows the most relative strength on the breakout: Direxion Energy Bull 3x (ERX), iShares Energy (IYE), SPDR Energy (XLE), and ProShares Ultra Oil & Gas (DIG).
Going into yesterday, we were already long U.S. Oil Fund (USO) and U.S. Gasoline Fund (UGA), both of which successfully tested support of their 50-day moving averages in yesterday's session. Additionally, we bought ERX just before yesterday's close, when it moved above its 20-EMA on the hourly chart, in anticipation of a "gap up" in the sector today. With crude oil futures trading approximately 5% higher in the pre-market, it looks as though all three of our energy-related ETFs should open significantly higher today. This would enable us to trail our stops higher, just below support of the newly formed "swing lows." The iShares Medical Devices (IHI), which we analyzed yesterday, remains on our watchlist as well. We'll continue to present new setups as the market's consolidation develops.
Deron Wagner is the Founder and Head Trader of both Morpheus Capital LP, a U.S. hedge fund, and Morpheus Trading Group, a trader education firm launched in 2001 that provides daily technical analysis of the leading ETFs and stocks. For a free trial to the full version of The Wagner Daily or to learn about Wagner's other services, visit MorpheusTrading.com or send an e-mail to deron@morpheustrading.com.
|