| The Little Known April Bullish Trend |
| By Price Headley |
Published
04/4/2009
|
Futures , Options , Stocks
|
Unrated
|
|
|
|
The Little Known April Bullish Trend
March 2009 certainly came in like a bearish lion, but exited as somewhat of a bullish lamb. We saw the market plummet reach its zenith on March 9, followed by a very strong rebound rally in the major indices. Now that we have entered April, we did some research on this month's historical performance, and the results are surprising and should help calm some fears of another imminent big leg down.
First, if you look at the data from this milennium, since 2000, April is the leading average percentage return for the S&P 500 Index at +1.46% average gain (see the below table). This is far stronger than any other month in that time frame -- and the second strongest month is May at +0.88%. So the Spring has been an outperforming season in general. The months that had the highest chance of being positive were August, followed by a May/October/November/December tie, so April has not been the highest in terms of a positive return (it is 55%).
S&P 500 Index Monthly Performance (since 2000)

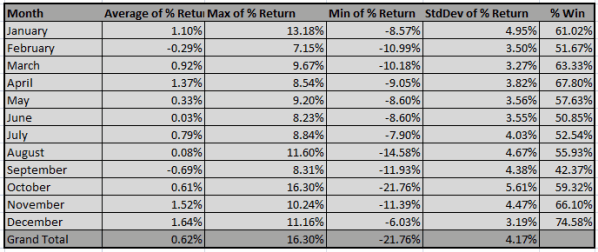
That is a fairly small sample size, so we looked back all the way to 1950 on the S&P 500 Index data. Note on the chart below that April is the third strongest month, with an average return of 1.37% and a 67.8% chance of being positive. November and December, which are commonly discussed as historically "strong" months for the market, are the biggest gainers on average. Data compiled from Yahoo Finance.
1950 to 2008 Monthly S&P 500 Performance

There are many market axioms concerning seasonality and months, such as "Sell in May and go away", "Up January equals up year", "Crashes occur in September/October/November", "Summers are slow and bad for technology stocks", and so on. Some of these expressions are proven true while others may be violated in any given year. The data above indicates that "April showers brings bullish flowers" may become a future cliche, albeit a tongue-in-cheek one. Of course nothing is guaranteed, because none of the months are up more than 75% of the time since 1950, but it's always good to have some historical statistical data in your favor when analyzing the market and risk/reward ratios.
Price Headley is the founder and chief analyst of BigTrends.com.
|