NASDAQ COMMENTARY
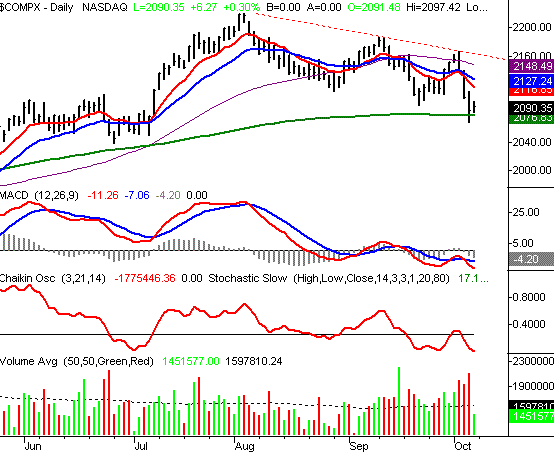
The NASDAQ ended the week at 2090.335, or 61.34 points below the prior week's close. That 2.8 percent dip was rather harsh, but it's still 21.31 points above the low of 2069.04. So, there's at least a little evidence that the bulls are prepared to strike back next week. On the other hand, we're not prepared to buy-in until we make a lot of technical progress.
Most of our analysis is on the Dow and the S&P 500 this week, but there is one item we do need to look at here.
Note that the NASDAQ is the only index that managed to stay above its 200 day line (green). The interesting part is that the NASDAQ managed to do that even though it also took the biggest net loss (percentage terms) last week. Part of the reason it was able to do that was just that it had gotten so far overextended in the first half of the year, and had the farthest to fall. But from a macro-view, we still think it means that there's a decent interest n the speculative names that tend to be listed on this exchange. In general, that's an encouraging sign for the whole market. And we may find that Thursday's brush with the 200 day average was just the upside catalyst this market needed. But still, look for a move above the 10 day line (at 2117) before jumping the gun.
On the other hand, a move under the 200 day line, or under Thursday's low of 2069.04 may be the downside catalyst the bears are waiting for.
Of the two possibilities, we favor the bullish scenario, but we're also waiting to see how the week starts out before diving into new bullish trades.
NASDAQ CHART - DAILY

S&P 500 COMMENTARY
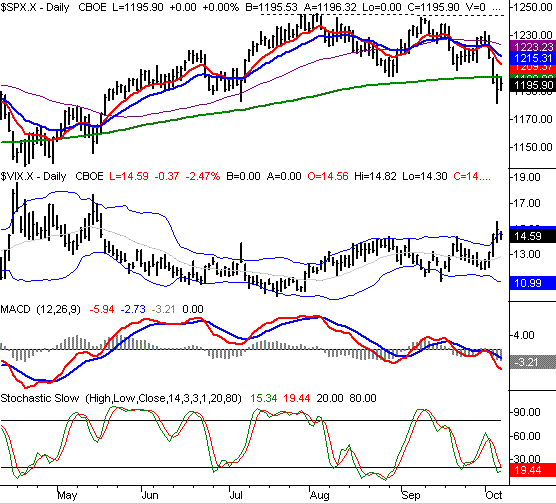
The S&P 500 gave up 33.01 points last week to close at 1195.90. That's a 2.7 percent plunge, but the SPX had been as low as 1182.14 before starting a small recovery move on Thursday. But still, like the NASDAQ, there's a huge amount of technical damage that needs to be undone before we can look for serious bullish continuation.
The most dramatic even the S&P's chart went through last week was a cross back under the 200 day line at 1200. That move not only pulled the index under a major long-term average, but also under the psychological support of the big, round number of 1200. So by most measures, we should be bearish. But as you'll read with the Dow's analysis, even this cross under the 200 day line isn't all that bearish yet. Why? Just look back to April. The S&P 500 spent a few days just under the mark then, but it ended up being the kickoff for a huge rally. That's not to say we'll absolutely get a repeat of that chart again, but after the rebound we saw on Thursday and to a smaller degree on Friday, we know that there are at least a few people looking to buy on the bigger dips. In other words, we don't have enough good evidence to say that stocks will continue to sink (and this is despite that fact that we have those two major sell signals we mentioned earlier).
The other parallel is the VIX. It peaked in April, and may have peaked again in the latter part of last week. These tops generally show a form of capitulation that typically marks the beginning of an upside move, which is also why we're hesitant to expect any more downside pressures.
So here's the plan....a close under Thursday's low of 1182.14 may break the fragile back of the proverbial camel. Even with the mild bullishness later in the week, investors and bulls are worried right now, and may not be able to stomach much more. We think the last straw could be 1182. On the other hand, we're not yet bullish either. We need to see a close all the way back above the 10 day line at 1209 before we can comfortably forecast a decent upside move. After that, the next resistance line is still at all the other key averages, and the 1245 mark.
S&P 500 CHART - DAILY

DOW JONES INDUSTRIAL AVERAGE COMMENTARY
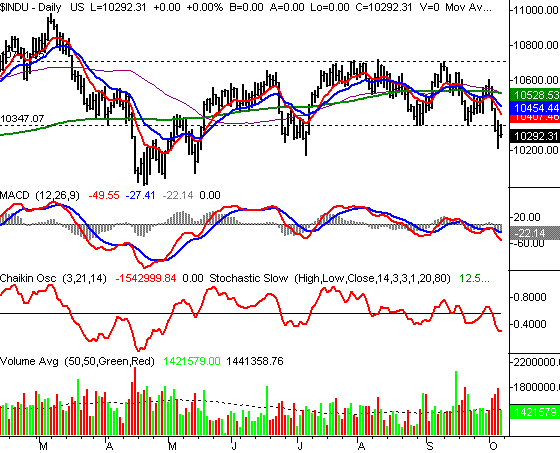
The Dow Jones Industrial Average closed at 10292.31last week, which was 276.39 points below the previous week's closing level. That 2.6 percent dip was inline with the losses taken by the other indexes. And like the other indexes, the Dow at least managed to close a few points above the week's low of 10218.09.
From a technical perspective, the Dow looks to be in fully bearish mode. In fact, there aren't too many sell signals that we don't have for the Dow. We saw a bearish MACD crossover on the 5th, a bearish Chaikin line cross on the same day, and the index itself is under all the key moving averages. But more than any of that, the support at 10350 was broken. So for the first time on a long time, the index has made a lower low after a lower high. From a strict technician's point of view, that's a 'bigger picture' bearish sign. And maybe that point of view will pan out, but.........
......we're still hesitant to adopt that outlook. Look back at the Dow this year. We've seen all these signals before, and almost all of them were quickly reversed (that includes up and down move). The mother of all moving average lines - the 200 day line (in green) - has been crossed nine different times now, and the Dow is basically where it was when all those crosses started on April 14th, The point is, the market has been painfully choppy and inconsistent, so we're not going to lose our heads here - especially after the mild bullishness we saw later in the Thursday and Friday sessions.
Let's wait and see what happens early in the coming week. If the selling continues in a methodical fashion, we can then justify going bearish. But if the buyers step back in and manage to push the Dow back above the 10 or 20 day lines (at 10407 and 10454), then we'll be pretty confident that the Dow will make yet another brief move higher, perhaps up to the 10700 mark again. We won't expect anything more than that, as we've seen this choppiness work in both directions this year.
DOW JONES INDUSTRIAL AVERAGE CHART - DAILY

Price Headley is the founder and chief analyst of BigTrends.com.