| Corcoran Technical Trading Patterns For April 6 |
| By Clive Corcoran |
Published
04/6/2009
|
Stocks
|
Unrated
|
|
|
|
Corcoran Technical Trading Patterns For April 6
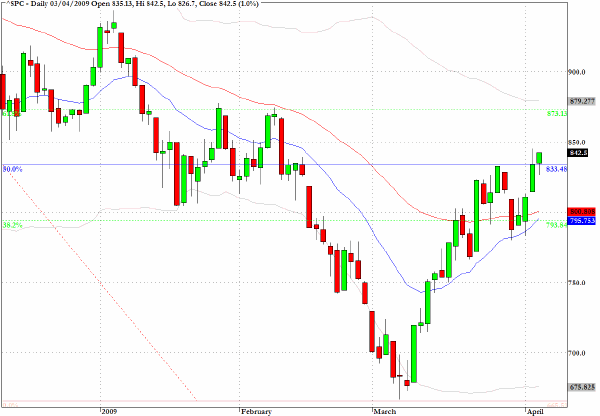
I believe that we are headed, possibly even in today’s session, for a test on the S&P 500 Cash index (SPX) of the 875 area which I have been proposing as a key level over the last several weeks.
This level represents the 62% retracement level within the fibonacci grid that I have discussed with 1000 on the top and 666 on the bottom. It is a level at which one should expect some choppy behavior and a contest to emerge between those embracing "the generational bottom is in place hypothesis", who have been getting things their own way a lot recently, and those who are still convinced that we are witnessing a bear market rally, which admittedly has been quite dynamic as such rallies can be, but that at the 62% retracement level we would be at a technical chart level where the likelihood of another abrupt sell-off is increasing.
Even if 666 was a major turning point - and I am still not entirely convinced that it was - I do believe that the recovery from this economic crisis is going to be anemic. As such the risks are that the more progress that the bulls make without a real setback and challenge being mounted by short sellers the more precipitous will be the next correction when it comes.
I shall not be publishing for the remainder of this week or indeed next Monday - which is a public holiday in the UK - and will return on Tuesday morning April 14 and would like to wish a Happy Easter to all readers.
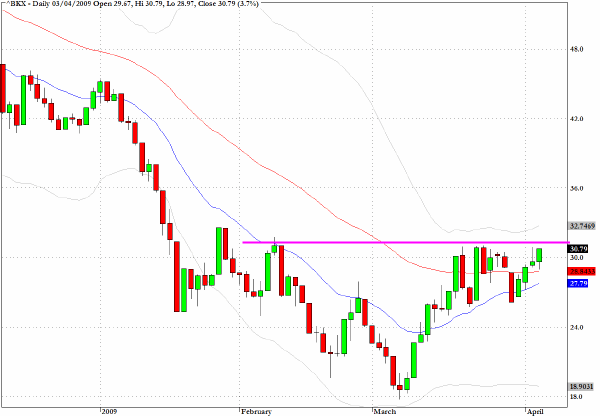
The KBW Banking Index (BKX) has a constructive-looking chart and the dynamics are suggesting that we are about to break above a key line of resistance and continue the recovery within the US banking sector from prices which were discounting insolvencies in a Depression like era.
Many in the blogosphere argue forcefully that some US banks still need to be restructured and even forced into public ownership, and, while that debate is certainly stimulating, the charts are suggesting that investors are seeing profit opportunities within the banking sector at least in the intermediate term.
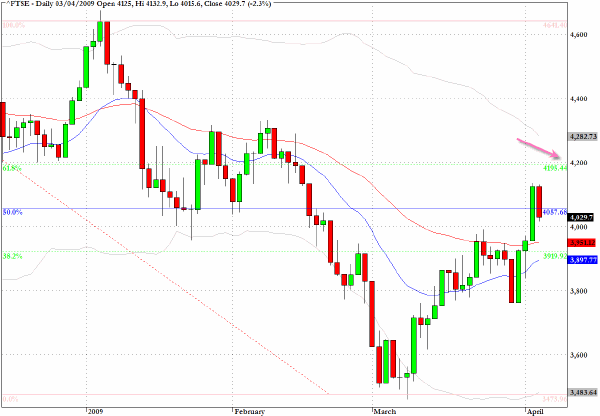
The FTSE is hovering as this is being written in the neighborhood of the 50% retracement level at 4060 but I would expect the 4200 area to be tested in coming sessions.
Similar reasoning to the discussion above applies to what one should expect at this 62% retracement level on the UK’s main equity index.
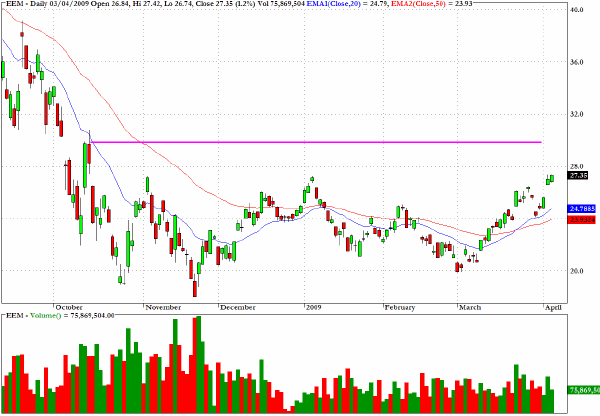
The exchange traded fund which tracks the MSCI Emerging Markets Index, EEM, seems set to challenge the high from the major mid-October reaction/reversal which was seen across almost all global indices and sectors.
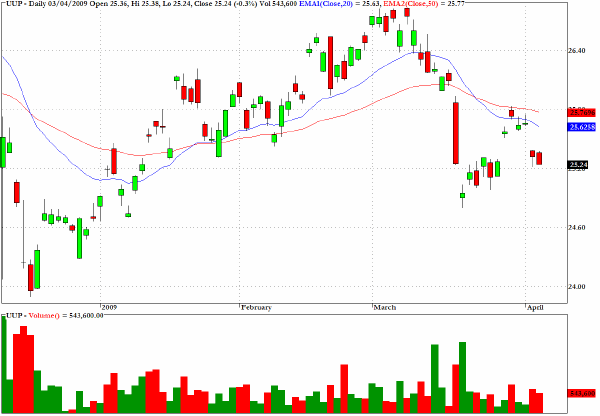
The technical condition of the US dollar as revealed in the ETF which represents a long position on the US Dollar index looks vulnerable. Traders can use the inverse version of this ETF, UDN, which enables one to go long the fund but benefit as the dollar weakens against major currencies.
In a piece at Seeking Alpha which was published yesterday, I discuss some of the implications of the recent G20 decisions and in particular the de-risking of marginal economies in Eastern Europe. One consequence of this will be a perception of reduced risk to the Eurozone and its currency which removes one factor responsible for dollar strength based on risk aversion factors.
Here are two brief extracts from the piece:
Assuming that the International Monetary Fund (IMF) is fully funded in line with the G20’s communique and expressed commitments, the risk of individual or even multiple failures at the nation state level, especially in the emerging markets of Eastern Europe, will have receded substantially.
My contention is that in de-risking marginal economies and marginal industries/sectors, we have not decreased the likelihood of systemic risk but may in fact have massively enhanced it. But that may not become apparent for a few more years.
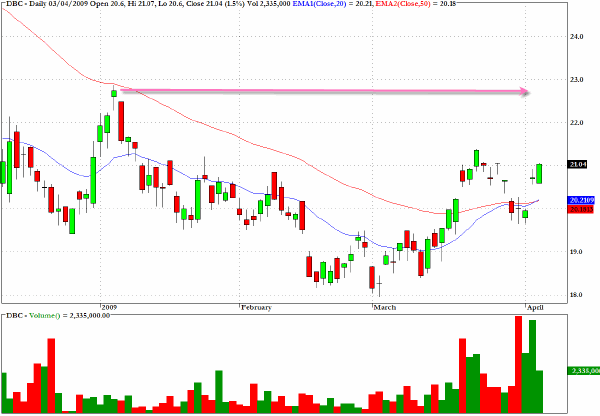
An intermediate-term target for DBC, which tracks a broad basket of commodities, would be the level seen in early January, close to $23.
Clive Corcoran is the publisher of TradeWithForm.com, which provides daily analysis and commentary on the US stock market. He specializes in market neutral investing and and is currently working on a book about the benefits of trading with long/short strategies, which is scheduled for publication later this year.
Disclaimer
The purpose of this article is to offer you the chance to review the trading methodology, risk reduction strategies and portfolio construction techniques described at tradewithform.com. There is no guarantee that the trading strategies advocated will be profitable. Moreover, there is a risk that following these strategies will lead to loss of capital. Past results are no guarantee of future results. Trading stocks and CFD's can yield large rewards, but also has large potential risks. Trading with leverage can be especially risky. You should be fully aware of the risks of trading in the capital markets. You are strongly advised not to trade with capital.
|