|
The Wagner Daily ETF Report For April 6
The recent bullishness persisted into the end of the week, enabling stocks to achieve another solid advance in last Friday's session. The major indices drifted sideways throughout most of the session, then made a late-day push into the close. The Nasdaq Composite rallied 1.2%, the S&P 500 1.0%, and the Dow Jones Industrial Average 0.5%. The small-cap Russell 2000 and S&P Midcap 400 indices climbed 1.3% and 1.7% respectively. Stocks finished at their intraday highs, and near their best levels of the week. Friday marked the fourth straight day of gains in the broad market, which registered its fourth consecutive weekly advance as well. For the week, the Nasdaq jumped 5%, the S&P 500 3.3%, and the Dow 3.1%.
Turnover backed off across the board, causing volume in both exchanges to fall back below average levels. Total volume in the NYSE eased 21%, while volume in the Nasdaq was 23% lighter. Nevertheless, remember that the previous day's Nasdaq volume was the highest of 2009. Furthermore, the Nasdaq still bagged three consecutive days of higher volume gains last week, a bullish sign of increasing institutional buying interest. Although volume was lighter, market internals were solid. In the NYSE, advancing volume beat declining volume by a margin of nearly 4 to 1. The Nasdaq adv/dec volume ratio was positive by 2 to 1.
Thanks to last week's bullish action, all the major indices are now in short and intermediate-term uptrends, as they have formed successive "higher highs" and "higher lows" on their daily charts. Obviously, the main stock market indexes are still in long-term downtrends, which is important to keep in the back of your mind, but it makes sense to capitalize on the short and intermediate-term strength while it lasts.
When the stock market's rally off the March lows first began, it was difficult to discern which sectors or indexes were showing the most relative strength, as essentially everything bounced sharply off the lows. However, now that stocks have been trending higher for the past month, specific sectors with relative strength are starting to make themselves known.
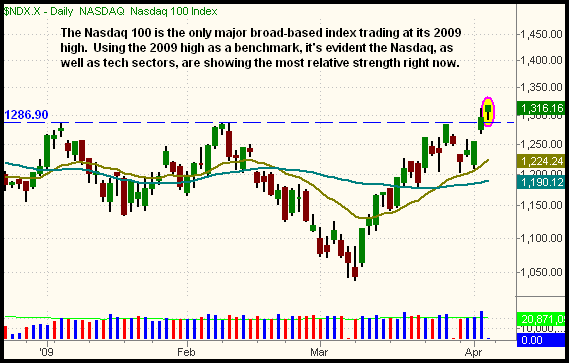
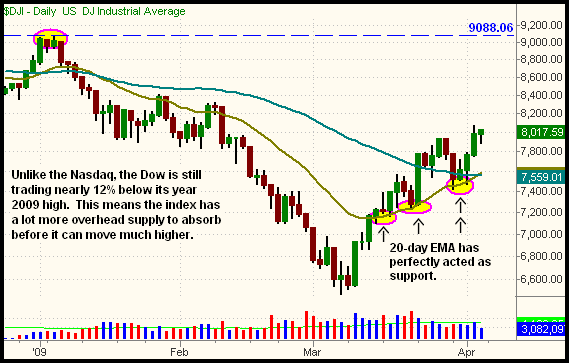
One simple way to determine which sectors, ETFs, and stocks are showing the most relative strength is to use their year 2009 highs as a benchmark. For example, of the main stock market indexes we track, only the Nasdaq 100 Index ($NDX) is now trading at its highest level of the calendar year. Its brother, the Nasdaq Composite, is within striking distance of following through to a 2009 high as well. However, both the S&P 500 and Dow Jones Industrial Average remain well below their January 2009 highs. Since the Nasdaq 100 is showing relative strength by trading at its 2009 high, the index has less overhead supply (price resistance) to contend with. Conversely, because of prior levels of price resistance, the S&P and Dow are going to require substantially more buying interest to move much higher, at least in the short-term. This comparison is illustrated on the daily charts of the Nasdaq 100 Index and Dow Jones Industrial Average below:


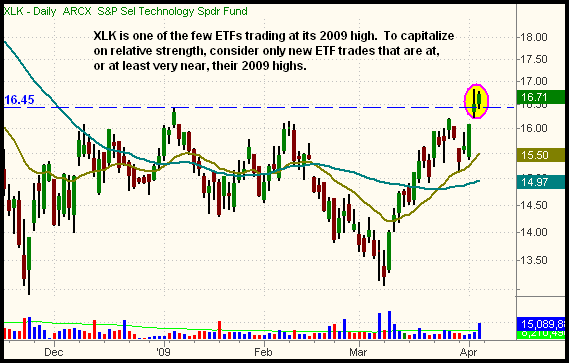
Armed solely with the knowledge the Nasdaq 100 is the only index already trading at its 2009 high, we now know that trades in Nasdaq-related (mostly tech) sectors have better odds of yielding profitable results than many "old economy" sectors that primarily comprise the Dow. The relative strength the Nasdaq's been displaying is one reason we bought Internet HOLDR (HHH) on March 23. Like the Nasdaq 100, HHH is also trading at its 2009 high. A handful of other technology-related ETFs, such as Semiconductor HOLDR (SMH) and S&P Technology SPDR (XLK), have stealthily moved to new highs as well. On the daily chart of XLK, shown below, notice the similar chart pattern to the Nasdaq 100 Index:

In addition to HHH, another tech-related ETF in our current portfolio is Claymore Global Solar Energy (TAN). Though it could easily be confused as solely an energy ETF, most of the companies that comprise TAN are actually tech companies that trade in the Nasdaq. Unlike HHH, TAN is still below its 2009 high, but we like the bullish consolidation on its daily chart, as well as the recent break of its six-month downtrend line.
Of our other five open ETF positions, three are correlated to oil/gas (ERX, USO, UGA), one is a bearish play on the U.S. dollar (UDN), and one is a precious metals commodity (SLV). Of these, we particularly like the recent price action in the oil/gas ETFs. After pulling back in the middle of last week, these ETFs rallied back to their recent highs, and are now poised to break out and make another leg up. Select individual oil-related stocks are also starting to display bullish chart patterns. FMC Technologies (FTI), for example, broke out to close the week at its 2009 high. The Wagner Daily's sister newsletter, The MTG Stalk Sheet, is presently showing a 3-point gain in FTI, which was bought on April 1.
Open ETF positions:
Long - HHH, TAN, ERX, USO, UGA, UDN, SLV
Short - (none)
Deron Wagner is the Founder and Head Trader of both Morpheus Capital LP, a U.S. hedge fund, and Morpheus Trading Group, a trader education firm launched in 2001 that provides daily technical analysis of the leading ETFs and stocks. For a free trial to the full version of The Wagner Daily or to learn about Wagner's other services, visit MorpheusTrading.com or send an e-mail to deron@morpheustrading.com.
|