|
The Wagner Daily ETF Report For April 7
Stocks broke their four-day winning streak yesterday, but lower turnover that accompanied the moderate pullback was healthy. The major indices opened lower, drifted south throughout the morning, then edged higher to trim their losses in the afternoon. The Dow Jones Industrial Average declined 0.5%, the S&P 500 0.8%, and the Nasdaq Composite 0.9%. The small-cap Russell 2000 lost 1.9% and the S&P Midcap 400 fell 1.2%. Though the Russell 2000 lost more than the other main stock market indexes, small-cap stocks have also led the broad market on the way up. The afternoon recovery off the lows enabled the Nasdaq to finish near its high of the day. The S&P and Dow closed in the upper quarter of their intraday ranges. It's a positive sign that the bulls showed late-day buying interest in the face of a "down" session.
Lighter volume across the board enabled the S&P and Nasdaq to avert the bearish label of a "distribution day." Total volume in the NYSE eased 12%, while volume in the Nasdaq was 7% lower than the previous day's level. Higher volume would have pointed to institutional selling into strength, but distribution among mutual funds, hedge funds, and other big players was notably absent yesterday. Market internals were negative, of course, but not by a wide margin. In both exchanges, declining volume exceeded advancing volume by a ratio of approximately 5 to 2.
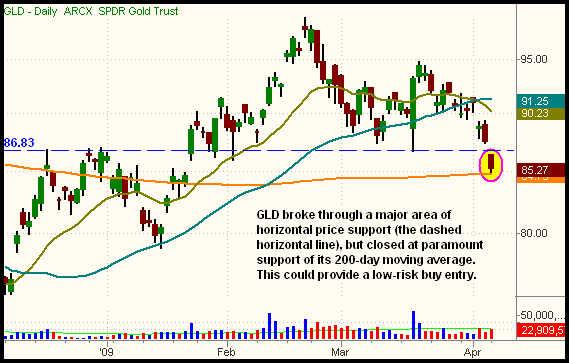
As investors' appetite for risk has been returning in recent weeks, most "defensive" plays like gold have been moving sideways to lower. Yesterday, SPDR Gold Trust (GLD) gapped down below a significant level of horizontal price support, closing at a ten-week low. However, GLD also closed right at paramount support of its 200-day moving average. This is shown on the daily chart below (the orange line is the 200-day MA):

As discussed in my book, Trading ETFs (Bloomberg Press, 2008), the 200-day moving average frequently acts like a "brick wall" when it comes to providing support or resistance. Rarely will a stock or ETF convincingly (with a violation of more than 3%) break through its 200-day moving average on the first attempt. In the case of GLD, the 200-day MA acted as resistance in September to October of 2008, as well as from December to January of 2009. Eventually, in late January, GLD confirmed its breakout above the 200-day MA. This causes prior resistance of that 200-day MA to now act as equally strong support.
With most ETFs, we like to buy breakouts above downtrend lines, or above areas of consolidation. However, with gold, we've observed and learned that buying pullbacks to key areas of support is a much better play than buying a breakout. Breakouts have simply been too choppy. Therefore, GLD is now presenting a low-risk entry point on the buy side, anywhere in the near proximity of its current price. However, be sure to keep a protective stop not more than about 5% below the 200-day MA ($80.50 area). Also note that an entry into GLD near its current price should be considered an intermediate to long-term buy entry, not a short-term play, as it could take a few weeks for gold to settle down in this area of support before heading higher.
There are two reasons it may be a good idea to lay low throughout the rest of the week, focusing on managing existing positions, rather than entering new ones. First, quarterly corporate earnings season officially kicks off today, with Alcoa (AA) slated to announce their latest numbers after the close. There's been a lot of speculation over the past several months as to how the next corporate earnings period would fare, but pure speculation is all it's been. As such, it's likely the stock market will be rather jittery and indecisive as investors and traders await and subsequently digest earnings reports from key, market-moving companies. Second, the market is closed for Good Friday holiday on April 10. As is the case with all three-day weekends, volume will probably be lighter than average ahead of the holiday. Light volume mixed with possible earnings jitters is a perfect recipe for whippy market action, the kind that will churn your trading account if you're not careful. To compensate, you might consider keeping your stops wide enough to provide your positions with substantial "wiggle room" for the rest of the week.
Open ETF positions:
Long - HHH, TAN, ERX, USO, UGA, UDN, SLV
Short - (none)
Deron Wagner is the Founder and Head Trader of both Morpheus Capital LP, a U.S. hedge fund, and Morpheus Trading Group, a trader education firm launched in 2001 that provides daily technical analysis of the leading ETFs and stocks. For a free trial to the full version of The Wagner Daily or to learn about Wagner's other services, visit MorpheusTrading.com or send an e-mail to deron@morpheustrading.com.
|