| The Wagner Daily ETF Report For April 9 |
| By Deron Wagner |
Published
04/8/2009
|
Stocks
|
Unrated
|
|
|
|
The Wagner Daily ETF Report For April 9
Stocks meandered through a wobbly session yesterday, but finished solidly higher across the board. Though the broad market stayed out of the red, the major indices oscillated between the flat line and substantially higher territory several times throughout the session. Cruising to a 1.9% gain, the Nasdaq Composite resumed its recent trend of leadership. The S&P 500 advanced 1.2%, the Dow Jones Industrial Average just 0.6%. The small-cap Russell 2000 rose 2.4%, as the S&P Midcap 400 climbed 1.5%. The main stock market indexes closed around the upper quarter of their intraday ranges.
Total volume in the NYSE increased 5% above the previous day's level, a bullish follow-up to several days of lighter volume losses. In the Nasdaq, however, turnover was 1% lower. In both exchanges, volume was well below 50-day average levels. This was not surprising, considering the approaching holiday weekend. Advancing volume in the NYSE exceeded declining volume by a ratio of 5 to 2. The Nasdaq adv/dec volume ratio was positive by a margin of nearly 4 to 1.
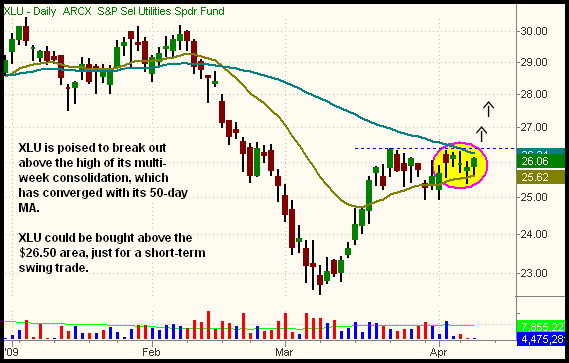
Next week, look for a potential breakout in the S&P Utilities SPDR (XLU). The setup is illustrated on the daily chart below:

Notice that the 50-day moving average (the teal line) has converged with the high of XLU's multi-week consolidation. As such, a rally above the $26.50 area should confirm a breakout above both the consolidation and 50-day MA, thereby sparking upward momentum for a short-term swing trade. The 20-day exponential moving average (the beige line) has provided support for the past couple of weeks, causing XLU to reverse higher after each probe below that short-term indicator of trend. If buying XLU on a breakout, a protective stop could therefore be placed below the April 7 "swing low" of $25.41, which is firmly below the 20-day EMA as well.
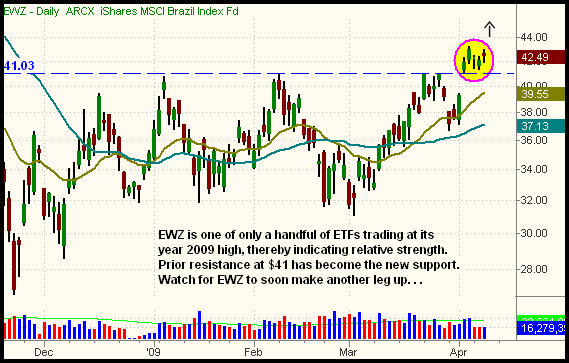
We also continue to like the tight price consolidation in iShares Brazil (EWZ), which is trading at its year 2009 highs:

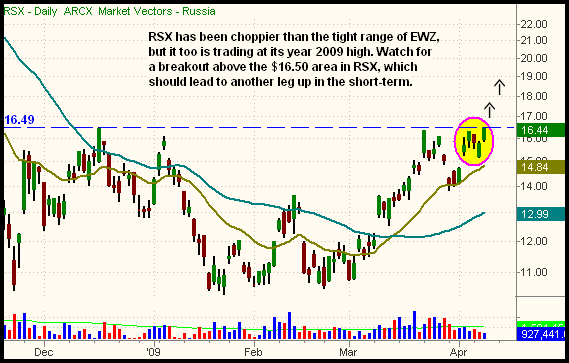
The dashed horizontal line marks prior resistance of EWZ, which has now become a new level of support. This is a good example of the most basic tenet of technical analysis; a prior level of resistance becomes the new support level, after the resistance is broken. Market Vectors Russia (RSX) is another international ETF consolidating at its year 2009 high. On the daily chart below, notice that RSX is poised to make another leg higher, as its new intermediate-term uptrend develops:

Yesterday's indecisive price action was as we anticipated it would be ahead of the holiday weekend. Today, expect volume to be even lighter, and trading to be choppier, especially in the afternoon. Traders often leave their desks early ahead of three-day weekends, so we don't expect much to happen today. Even if stocks follow through on yesterday's rally, we would not place a high degree of trust in a rally that's backed by very light volume. After traders return to work next week, we'll get a much better feeling for the stock market's true strength or weakness at this juncture, especially as more quarterly earnings reports are released.
NOTE: The stock market will be closed tomorrow, April 10, in observation of Good Friday holiday. As such, The Wagner Daily will not be published tomorrow, but regular publication will resume on Monday, April 13.
Open ETF positions:
Long - HHH, TAN, ERX, USO, UGA, UDN, SLV, SKF
Short - (none, but SKF is a bearish, inversely correlated ETF)
Deron Wagner is the Founder and Head Trader of both Morpheus Capital LP, a U.S. hedge fund, and Morpheus Trading Group, a trader education firm launched in 2001 that provides daily technical analysis of the leading ETFs and stocks. For a free trial to the full version of The Wagner Daily or to learn about Wagner's other services, visit MorpheusTrading.com or send an e-mail to deron@morpheustrading.com.
|