| The McMillan Options Strategist Weekly |
| By Lawrence G. McMillan |
Published
04/11/2009
|
Options
|
Unrated
|
|
|
|
The McMillan Options Strategist Weekly
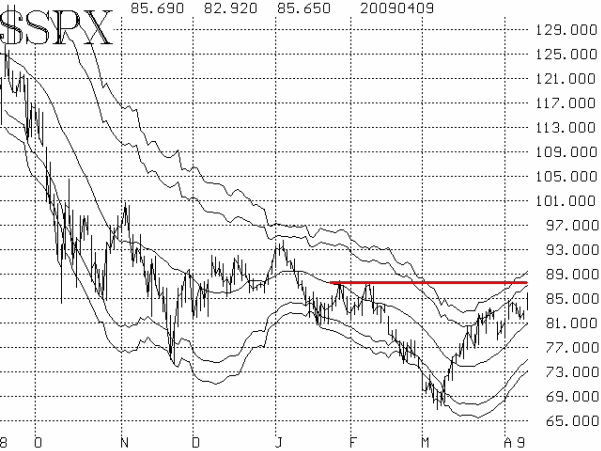
The stock market rally continues to move ahead at a pace that is quite fast. The 20-day moving average has not been touched since it was first crossed over, on March 12th. That in itself is rare. At least there is a clear series of higher highs and higher lows on the $SPX chart. That makes the chart bullish, and as long as the index stays near or above the rising 20-day moving average, $SPX will be bullish. There is resistance at $SPX 880, but only a close below 780 would turn the chart negative at this time.

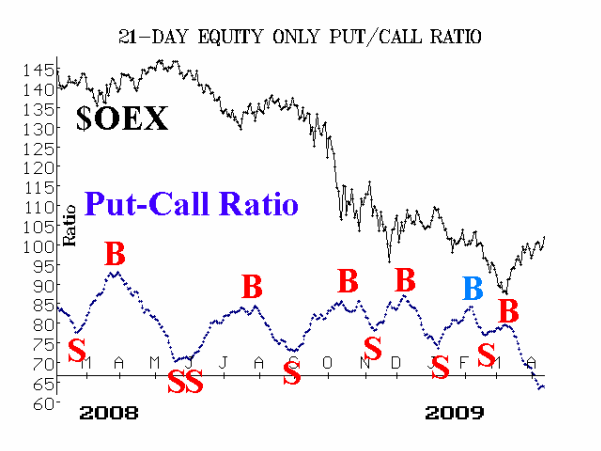
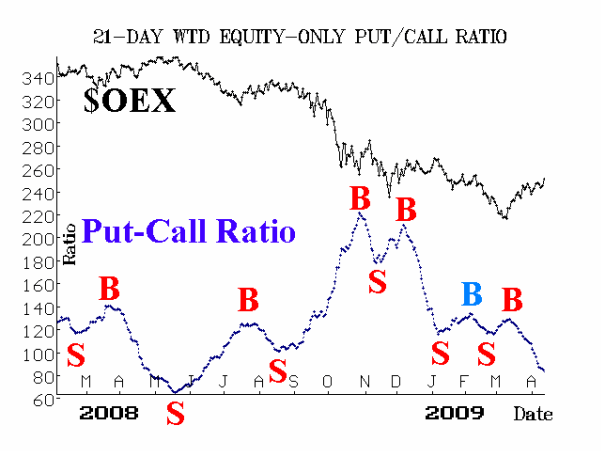
The equity-only put-call ratios continue to decline at a fast pace. Earlier this week, it appeared that they might be curling over, but that was set aside with Thursday's strong rally. As long as these ratios continue to decline, they will be on buy signals -- no matter how low on their charts they get. Having said that, they should be considered "overbought" -- especially the standard ratio, which is at multi-year lows.

Market breadth has been generally strong during the rally, moving into deeply overbought territory on several occasions, but falling back out of it when the market backs off a small amount. Thus, this current breadth action is positive, indicating that this is an intermediate-term bullish phase, at a minimum.

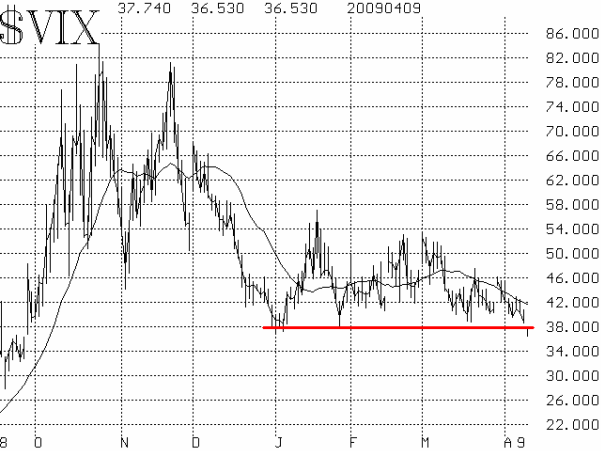
Volatility indices have worked their way lower this week, and $VIX closed at its lowest level since last September. This, too, is bullish. Not only is $VIX at relatively low levels, but it is trending downward as well. If $VIX should rally -- say climbing back above 42 -- then that would negate the bullishness of the declining $VIX. Otherwise, this indicator is also bullish.

In summary, the indicators are bullish, but some are quite overbought. When such conditions exist, sharp but short-lived declines are possible -- although they have been particularly short-lived so far. At this time, the major trend is higher.
Lawrence G. McMillan is the author of two best selling books on options, including Options as a Strategic Investment, recognized as essential resources for any serious option trader's library.
|