| Corcoran Technical Trading Patterns For April 14 |
| By Clive Corcoran |
Published
04/14/2009
|
Stocks
|
Unrated
|
|
|
|
Corcoran Technical Trading Patterns For April 14
The Easter break was refreshing although I ended up spending most of my time writing feverishly on the book that I am currently working on. I reopened my text file for this column and re-read the first sentence of the last commentary which appeared - a week ago exactly. The sentence equally applies today.
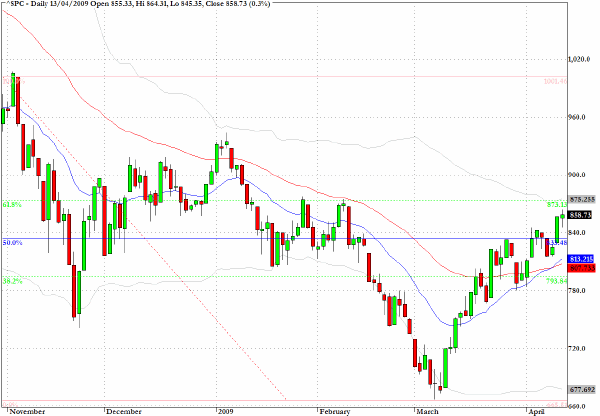
I believe that we are headed, probably in today's session, for a test on the S&P 500 Cash index (SPX) of the 875 area which I have been proposing as a key level over the last several weeks.
There is of course the slightly awkward notion that since writing this on April 6th the market took a rather nasty excursion to the downside. But not to worry that is the nature of the fine tight-rope that traders are currently walking.
Apropos this I commented yesterday that I have been watching Abby Cohen's cheerful pronouncements on US equities for more years than I care to remember and she is sounding more perky again as overall market sentiment is improving.
Her target of 1000 on the S&P 500 is still a long way off but given the massive injections of anti-depressants and the flood of "Get well soon" messages, coming in from pension fund managers and insurance companies sitting on 30-40% losses from last fall, this rally/bubble could have a way to go yet and may hit her target sooner rather than later.
I am still persuaded though that the faster the ascent the more scary the subsequent decline.
Also worth repeating is the second chart I showed a week ago and the accompanying comment.
The KBW Banking Index (BKX) has a constructive looking chart and the dynamics are suggesting that we are about to break above a key line of resistance and continue the recovery within the US banking sector from prices which were discounting insolvencies in a Depression like era.
Many in the blogosphere argue forcefully that some US banks still need to be re-structured and even forced into public ownership and while that debate is certainly stimulating the charts are suggesting that investors are seeing profit opportunities within the banking sector at least in the intermediate term.
And so it goes on.

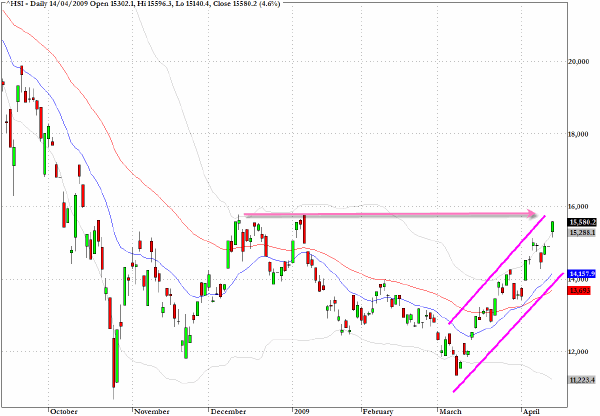
The Hang Seng Index (HSI) in Hong Kong moved up by 4.6% in trading on Tuesday after an extended holiday over Easter which, in line with European markets, was also closed on Monday.
The index has traced a remarkable "V" shaped trajectory but as suggested by the lines drawn on the chart one should expect some firm resistance at the 16000 level
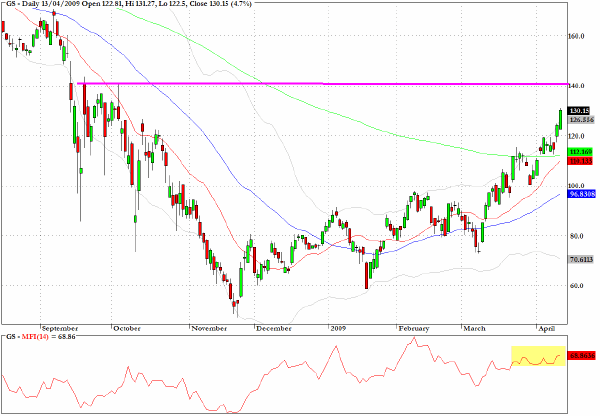
A couple of weeks ago I expressed some concerns about Goldman Sachs (GS) from a technical perspective as the money flow (MFI) and On Balance Volume (OBV) indicators were flashing warning signals. The stock has continued to rally still showing negative divergences but the $140 level could be touched soon and this may be a good exit place if you have been riding the wave up.
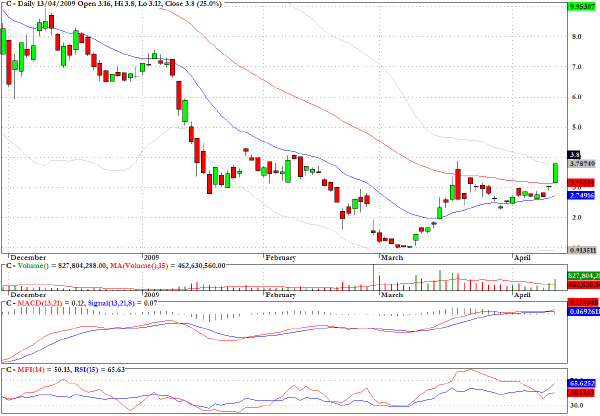
Citigroup (C) surged ahead by 25% yesterday on increasing optimism about the banking sector. It is remarkable that one could have more than tripled one's money by buying this stock when it was trading below a dollar intraday on March 5th.
The surge upwards brought yesterday's close to the upper Bollinger band and there does appear to be chart resistance in the $3.80-$4.00 region.
Wonders are many and none so wonderful as a stock that was written off as a basket case a few weeks ago but which is now mounting one of the most dramatic recoveries ever. That's why the US markets never cease to surprise me and also I suspect why they will always attract the most adventurous risk capital.
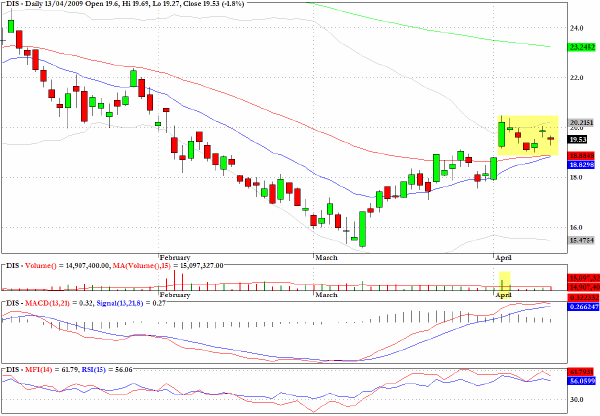
Disney (DIS) has evidence of a bull flag formation.
Clive Corcoran is the publisher of TradeWithForm.com, which provides daily analysis and commentary on the US stock market. He specializes in market neutral investing and and is currently working on a book about the benefits of trading with long/short strategies, which is scheduled for publication later this year.
Disclaimer
The purpose of this article is to offer you the chance to review the trading methodology, risk reduction strategies and portfolio construction techniques described at tradewithform.com. There is no guarantee that the trading strategies advocated will be profitable. Moreover, there is a risk that following these strategies will lead to loss of capital. Past results are no guarantee of future results. Trading stocks and CFD's can yield large rewards, but also has large potential risks. Trading with leverage can be especially risky. You should be fully aware of the risks of trading in the capital markets. You are strongly advised not to trade with capital.
|