| Corcoran Technical Trading Patterns For April 17 |
| By Clive Corcoran |
Published
04/17/2009
|
Stocks
|
Unrated
|
|
|
|
Corcoran Technical Trading Patterns For April 17
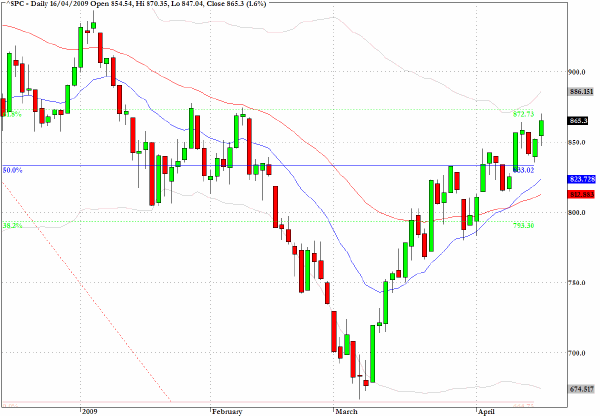
The S&P 500 (SPX) is just ten points shy of the 875 target (the 62% retracement level) which was identified here several weeks ago.
The next few sessions should make clearer whether we will get a period of consolidation at this level before another target comes into play - the 935 level from early January - or whether there could be some new vigor from bearish index traders to challenge the attainment of the key retracement level.
This piece on price deflation (according to official statistics at least) caught my eye yesterday:
The Consumer Price Index for All Urban Consumers (CPI-U) increased 0.2 percent in March, before seasonal adjustment, the Bureau of Labor Statistics of the U.S. Department of Labor reported today. The index has decreased 0.4 percent over the last year, the first 12-month decline since August 1955.
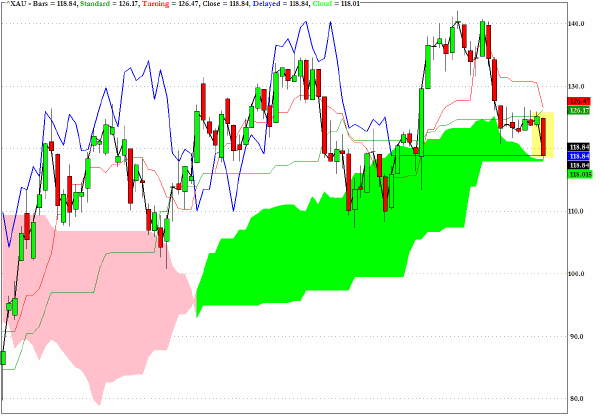
As anticipated in yesterday’s column, the Gold and Silver index (XAU) was ripe for corrective action in the context of a bearish flag formation. The index dropped by five percent on the session.
The Ichimoku chart reveals that the index has not yet dropped below the green cloud, which would be a significant bearish development, but the precious metals sector is at a critical juncture as is the price of gold itself.
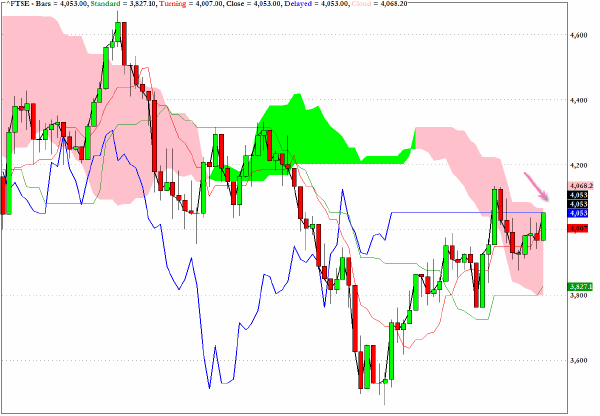
Unlike many of the key global stock indices, the FTSE has still not emerged above the pink cloud on the Ichimoku chart which would provide further evidence of bullish price action ahead.
As can be seen, the level for the index to move above the pink cloud is 4068 which also is exactly the 50% retracement level of the fibonacci grid that I have been super-imposing on this chart in recent commentaries.
The 4200 level would be the 62% retracement level for the FTSE as the 875 level is for the S&P 500.
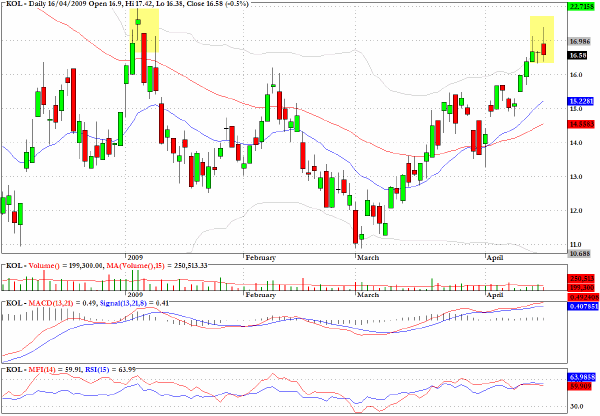
KOL is an exchange traded fund which tracks U.S. and foreign companies principally engaged in the coal industry. The chart reveals long upper tails in recent sessions as price has moved towards the levels seen in early January.
The shooting star pattern observed yesterday with an intraday high of $17.42 suggests that another attempt to reach back to the $17.62 level seen on January 6 could prove to be a good entry point on the short side.
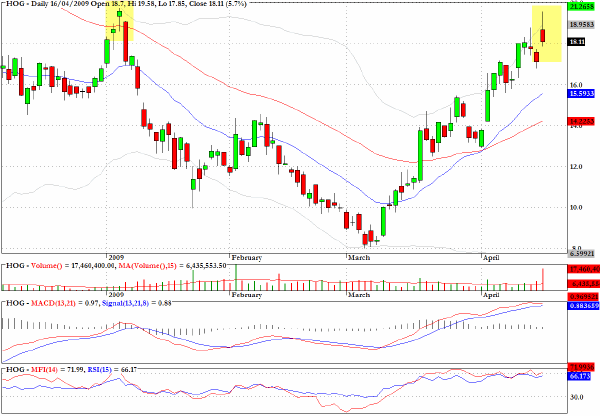
Harley Davidson (HOG) appears to be running into serious resistance just below the 2009 high level and the striking shooting star pattern would keep this chart on my Watch List for the short side in coming sessions.
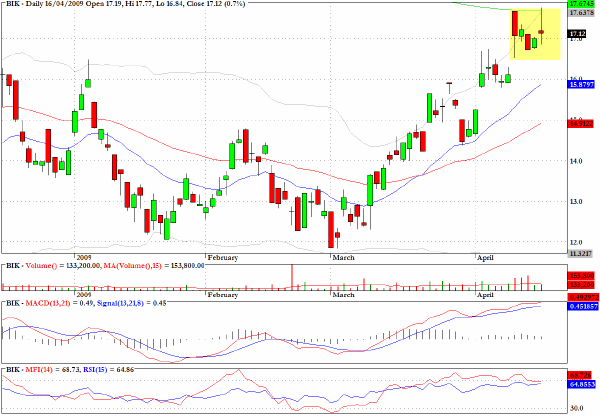
One of the exchange traded funds which tracks the BRIC emerging market sector, BIK, has another shooting star pattern where the intrday high touched the 200-day EMA and met price rejection.
Clive Corcoran is the publisher of TradeWithForm.com, which provides daily analysis and commentary on the US stock market. He specializes in market neutral investing and and is currently working on a book about the benefits of trading with long/short strategies, which is scheduled for publication later this year.
Disclaimer
The purpose of this article is to offer you the chance to review the trading methodology, risk reduction strategies and portfolio construction techniques described at tradewithform.com. There is no guarantee that the trading strategies advocated will be profitable. Moreover, there is a risk that following these strategies will lead to loss of capital. Past results are no guarantee of future results. Trading stocks and CFD's can yield large rewards, but also has large potential risks. Trading with leverage can be especially risky. You should be fully aware of the risks of trading in the capital markets. You are strongly advised not to trade with capital.
|