| The McMillan Options Strategist Weekly |
| By Lawrence G. McMillan |
Published
04/17/2009
|
Options
|
Unrated
|
|
|
|
The McMillan Options Strategist Weekly
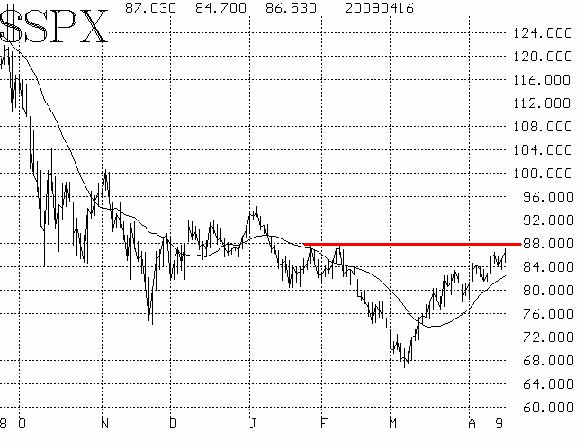
To put it simply, the broad market remains quite strong and continues to gather strength. $SPX has not once pulled back even to its 20-day moving average since it was first crossed in early March. $SPX has registered a consistent series of higher highs and higher lows,which is bullish, and the 20-day moving average is rising.

The $SPX chart exhibits resistance near the late January and early February tops in the 875-880 area. That may prove to be a stumbling block for the market in its current overbought state. Any pullbacks --if limited to the general neighborhood of the 20-day moving average -- would be healthy and thus would not disturb the intermediate-term bullish trend. However, a decline below support at 780-790 would be significantly bearish. We don't expect that in the near term, but it is a significant support level.

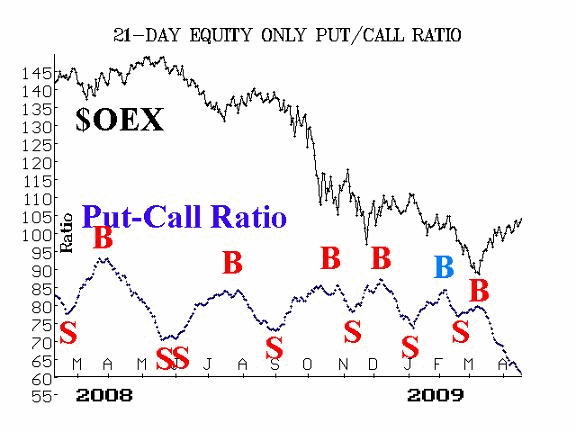
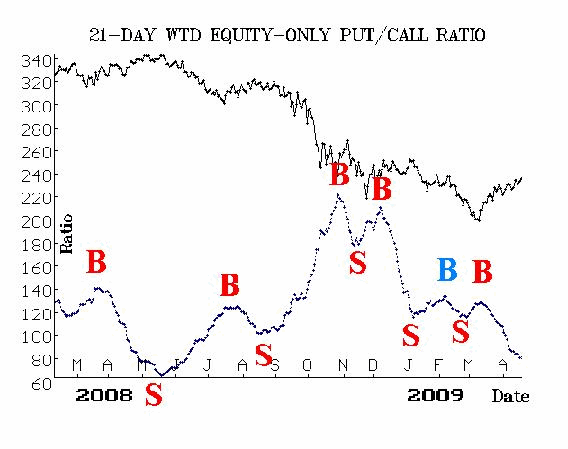
The equity-only put-call ratios continue to decline rapidly, and that is bullish. But with the ratios so low on their charts, they are considered "overbought" as well.

Market breadth has been very positive pushing breadth deeply into overbought territory during most of the last two weeks.
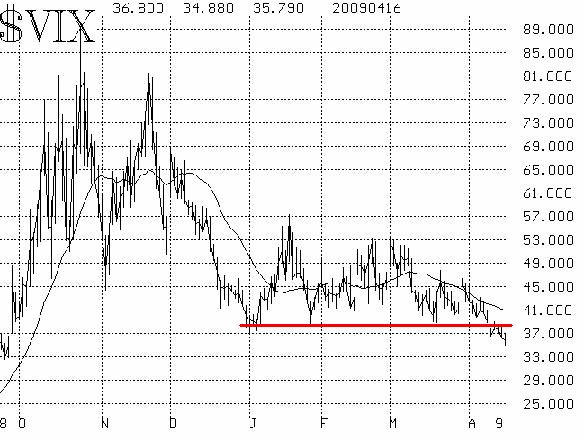
Volatility indices ($VIX and $VXO) have grudgingly, it seems,fallen to their lowest levels since last September. Even so, they remain in the mid-30's -- an area which previously had only been associated with extreme volatility. The trend of volatility is lower, and that is bullish.

In summary, the indicators are bullish. However, many of these indicators are overbought ($SPX far above its moving average, put-call ratios at the bottom of their charts, and market breadth oscillators above +500), so that a sharp, but short-lived correction is possible. However, as long as that correction doesn't fall significantly below the 20-day moving average (say below 780), then the intermediate term trend is still bullish.
Lawrence G. McMillan is the author of two best selling books on options, including Options as a Strategic Investment, recognized as essential resources for any serious option trader's library.
|