| Corcoran Technical Trading Patterns For April 20 |
| By Clive Corcoran |
Published
04/20/2009
|
Stocks
|
Unrated
|
|
|
|
Corcoran Technical Trading Patterns For April 20
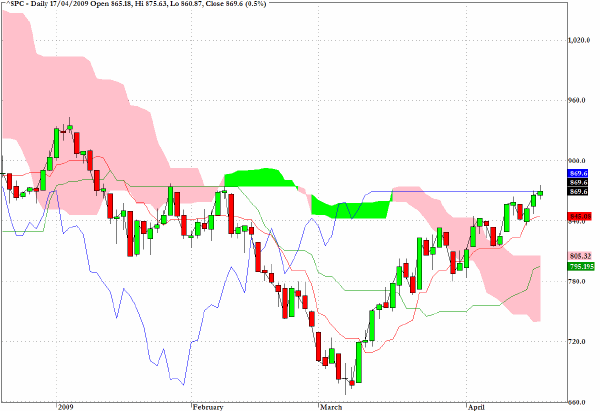
The S&P 500 (SPX) reached up and registered an intraday high just above the 875 target (the 62% retracement level) which was identified here several weeks ago.
Having risen decisively above the pink cloud on the Ichimoku chart, the odds favor the bullish case with a possible test of the 935 level seen in early January as a feasible target. Weakness in Europe and some significant failures in the currency market by sterling and the euro along with some other indicators from the very low yields on 30-day T-bills could, however, be pointing to some short-term dislocations. Also, with earnings season now in full force, this would be a good time to move to the sidelines with a view to stalking short positions on the broad market if signs of a tradeable pullback emerge.
In European trading on Monday morning, the euro has dropped below the $1.30 on its cross rate with the US Dollar and perhaps more ominously it is now losing contention with the green cloud on the chart below, which, if validated in the next couple of sessions, would suggest a revisit to the $1.25 area.

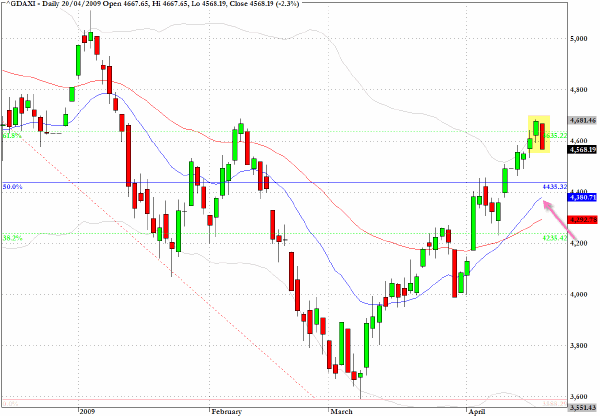
The Dax Index, after having risen above a key retracement level on Friday, has retreated by 2.5% as this is being written and a pullback to the 4380 level now seems likely.
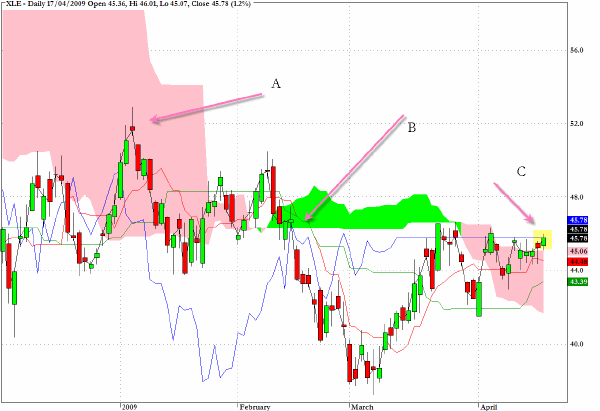
Reviewing many of the sector funds over the weekend, one of the Ichimoku patterns which is well formed and caught my attention is for XLE, which tracks a variety of energy companies and assets.
Point A indicated on the chart illustrates a failure in early January to emerge from the pink cloud, point B confirms the break down which culminated in the early March low and as can be seen the point C on the right hand side of the chart is the most bullish indication on the chart as price is emerging from the pink cloud. One would like to see a couple more closes above the pink cloud in coming sessions which would provide a good buy signal for the sector.
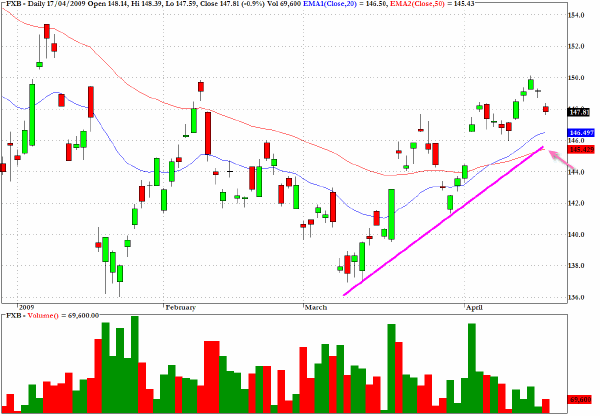
As the chart for FXB reveals, the British pound failed at the $1.50 level and would now appear to be headed in short order back to the $1.45 level.
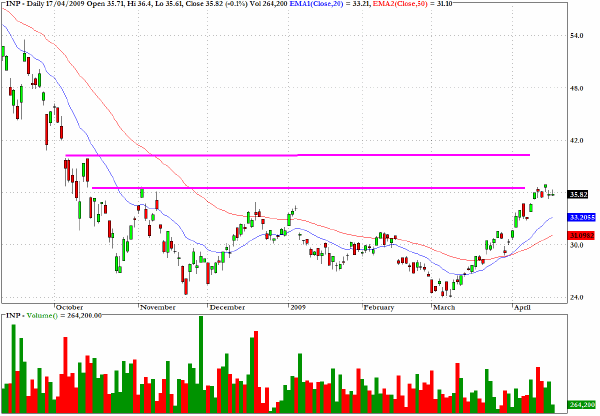
The exchange traded fund which tracks the MSCI India Index, INP, is at threshold of a zone which may present very short-term resistance and almost certainly will present more substantial resistance if the first hurdle is crossed.
The risk/reward matrix within the price zone indicated on the chart is unfavorable and would keep me on the sidelines of this emerging market in the near term but with a bias towards a re-entry on the long side longer term.
Clive Corcoran is the publisher of TradeWithForm.com, which provides daily analysis and commentary on the US stock market. He specializes in market neutral investing and and is currently working on a book about the benefits of trading with long/short strategies, which is scheduled for publication later this year.
Disclaimer
The purpose of this article is to offer you the chance to review the trading methodology, risk reduction strategies and portfolio construction techniques described at tradewithform.com. There is no guarantee that the trading strategies advocated will be profitable. Moreover, there is a risk that following these strategies will lead to loss of capital. Past results are no guarantee of future results. Trading stocks and CFD's can yield large rewards, but also has large potential risks. Trading with leverage can be especially risky. You should be fully aware of the risks of trading in the capital markets. You are strongly advised not to trade with capital.
|