| Corcoran Technical Trading Patterns For April 21 |
| By Clive Corcoran |
Published
04/20/2009
|
Stocks
|
Unrated
|
|
|
|
Corcoran Technical Trading Patterns For April 21
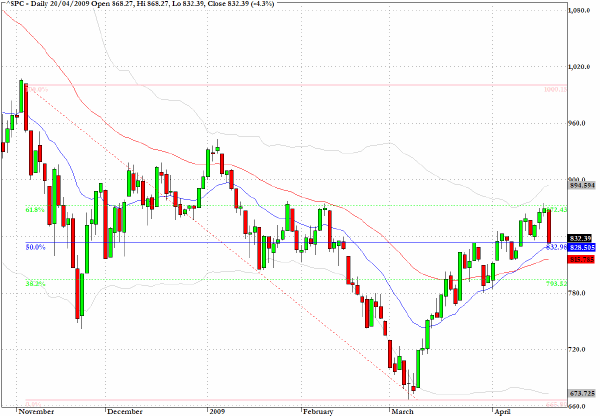
As suggested in yesterday's comments the S&P 500 (SPX), having achieved a critical target of 875 during Friday's session proved vulnerable to a bout of selling which was anticipated by some dislocations within the currency markets in Asian and European trading before the US session opened yesterday.
The characteristics of the "deflation trade" were in evidence yesterday with a stronger dollar, stronger Treasuries, weaker equities and a decline in commodity related and early cyclicals equities.
On the downside there are two levels to pay attention to - 815 is the approximate 50-day EMA and 795 is the 38% retracement level from the application of the 1000/666 grid which I have previously discussed.
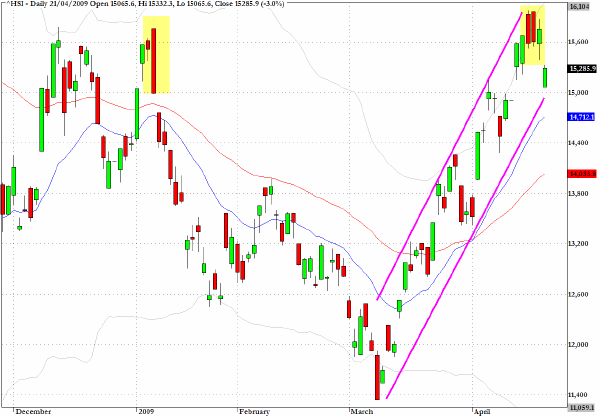
The Hang Seng Index (HSI) dropped 3% in Tuesday's session but still remains within a remarkably steep buy channel.
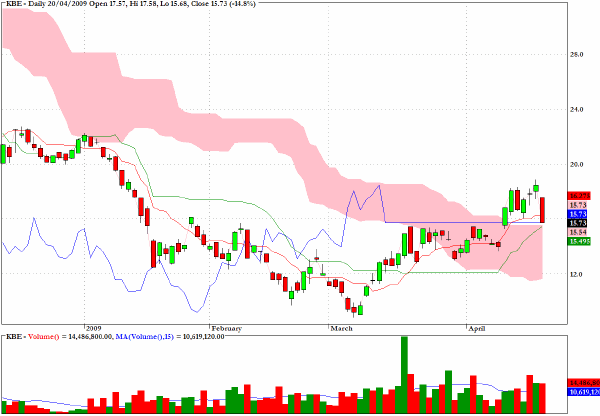
KBE, is the exchange traded fund which tracks the KBW Banking Index (BKX) and as can be seen the volume has been substantial during the recent decline.
The action over the next few sessions will be vital for this sector as a drop below the 50-day EMA at $15 and re-entry from above into the pink cloud on the Ichimoku chart would raise a question again about whether doubts could be mounting again regarding the solvency of some of the largest banks.
When stocks like Citigroup (C) and Bank of America (BAC) drop more than 20% in a single session, notwithstanding their remarkable recent rallies, it underlines how sentiment towards the banking sector is still fragile.
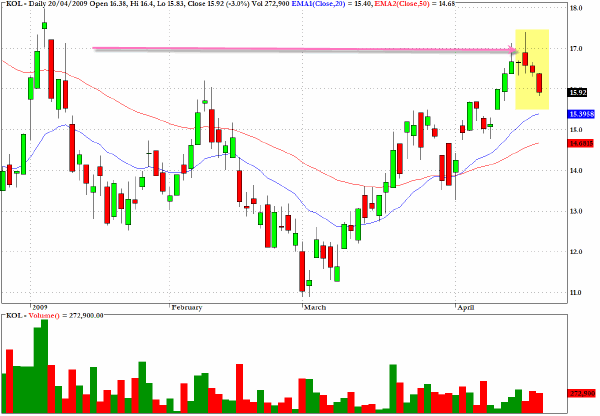
As suggested in last Friday's commentary, KOL, which is an exchange traded fund which tracks U.S. and foreign companies principally engaged in the coal industry, was revealing a topping pattern as it approached the early January high.
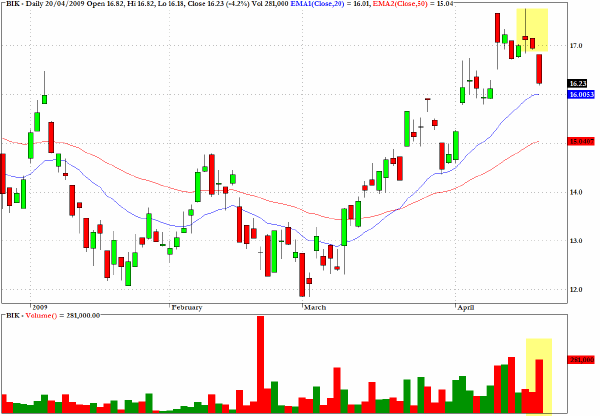
A similar comment to the one above for KOL was made last Friday for an exchange traded funds which tracks the BRIC emerging market sector, BIK,
The pattern had a shooting star pattern where the intraday high touched the 200-day EMA and met price rejection and selling Friday's open would have produced a two day return in excess of six percent.
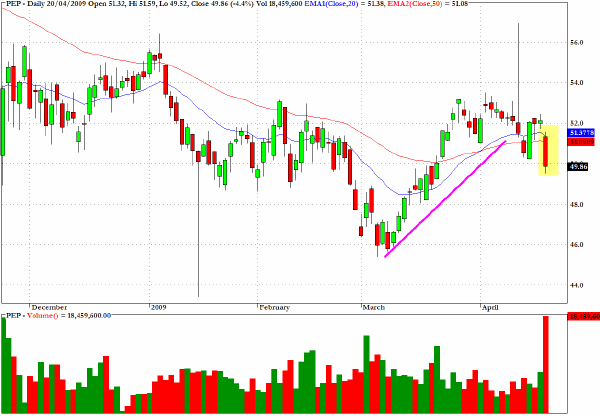
Pepsi (PEP) dropped decisively below two key moving averages on substantial volume.
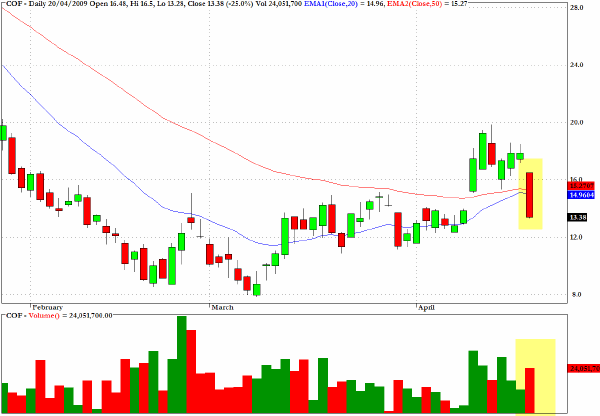
Capital One Financial, COF, shares the same pattern as Pepsi with a drop below two moving averages and a violation of a trend line.
Clive Corcoran is the publisher of TradeWithForm.com, which provides daily analysis and commentary on the US stock market. He specializes in market neutral investing and and is currently working on a book about the benefits of trading with long/short strategies, which is scheduled for publication later this year.
Disclaimer
The purpose of this article is to offer you the chance to review the trading methodology, risk reduction strategies and portfolio construction techniques described at tradewithform.com. There is no guarantee that the trading strategies advocated will be profitable. Moreover, there is a risk that following these strategies will lead to loss of capital. Past results are no guarantee of future results. Trading stocks and CFD's can yield large rewards, but also has large potential risks. Trading with leverage can be especially risky. You should be fully aware of the risks of trading in the capital markets. You are strongly advised not to trade with capital.
|