| The McMillan Options Strategist Weekly |
| By Lawrence G. McMillan |
Published
04/24/2009
|
Options
|
Unrated
|
|
|
|
The McMillan Options Strategist Weekly
The stock market correction has begun. Overbought conditions had persisted to an extent that was untenable, and so they must be worked off. The question remains, though, as to whether the correction is a mild, sideways affair or something far more nasty to the downside. Let's examine the indicators to see what clues we can find.
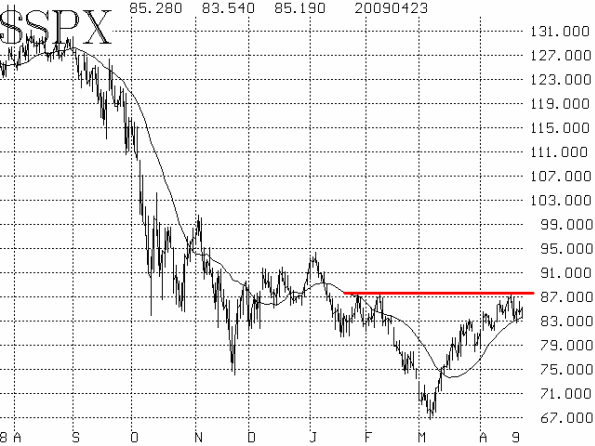
$SPX clearly ran into resistance near 875-880 -- the same level that halted rallies in late January and early February (See Figure 1). If this area is eventually breached to the upside, it would be very bullish and all correction/bearish scenarios would have to be set aside; we don't expect that to be the case in the near term.

On the downside, there is support near 830, then 810, and then 780-790. A violation of the 810 level and especially of the 780 level would be bearish. For now, $SPX appears to be in a trading range between 810 and 875. A breakout in either direction would be significant and should be traded.
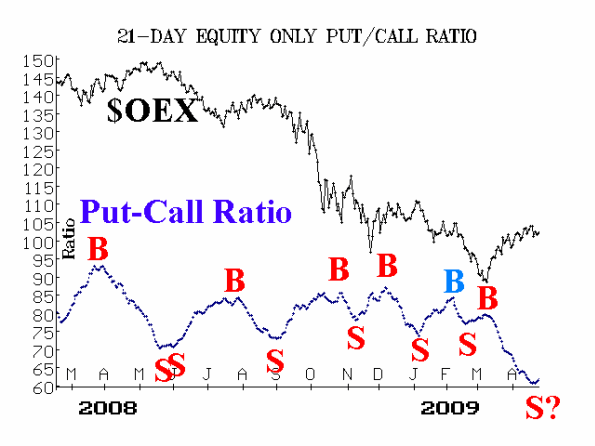
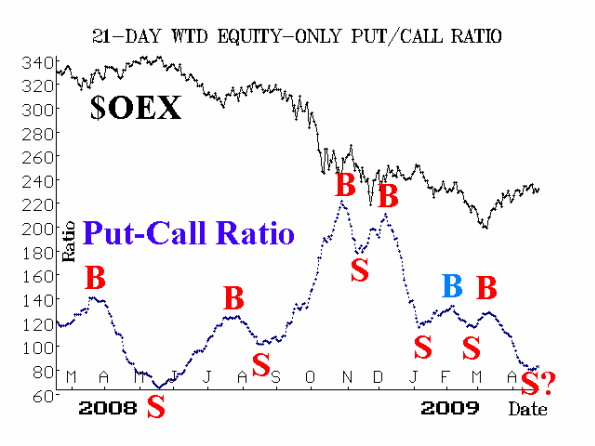
The equity-only put-call ratios appear to be rolling over to sell signals. To the naked eye, it appears that they already have, in fact, completed the rollover (see Figures 2 and 3). However, the computer program that we use to analyze put-call ratio charts has still not confirmed such sell signals.

Market breadth remains extremely overbought at this time, although it is clearly tiring. Breadth needs to moderate some in order to relieve its overbought position.

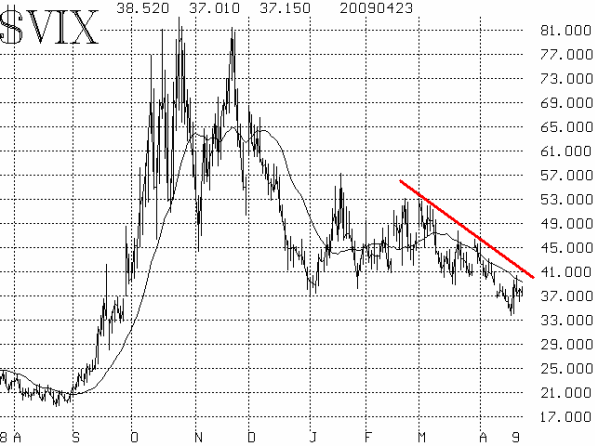
Volatility indices ($VIX and $VXO) remain in downtrends, and that is bullish for the broad stock market. They are still at fairly high levels, in absolute terms -- near 37 -- so that market moves will continue to be volatile. It's just that they were much higher, and thus are declining on their charts. Only a close above 41 by $VIX would interrupt the downtrend -- and would be bearish.

In summary, the market needs to work off the overbought condition, which had reached unsustainable levels. The bullish scenario is that the market trades more or less sideways, alleviating the overbought conditions more with the passage of time and with some minor corrections -- perhaps over a period of several months. The bearish scenario is that the bear market resumes in force, and the next leg down is of the nasty variety that we've repeatedly seen over the past year and a half. We don't know for sure which it will be, but the bullish scenario seems more likely given the strength seen since the early March bottom.
Lawrence G. McMillan is the author of two best selling books on options, including Options as a Strategic Investment, recognized as essential resources for any serious option trader's library.
|