| Corcoran Technical Trading Patterns For April 27 |
| By Clive Corcoran |
Published
04/26/2009
|
Stocks
|
Unrated
|
|
|
|
Corcoran Technical Trading Patterns For April 27
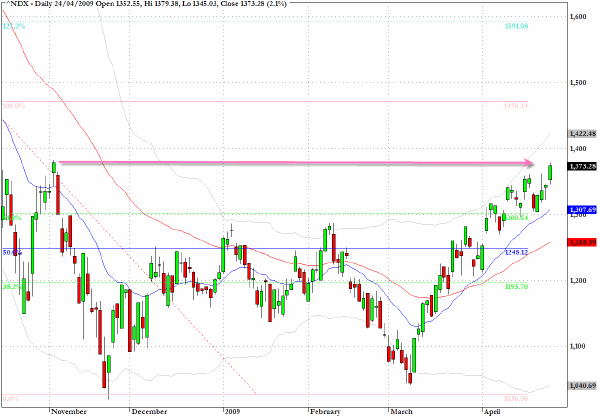
Following Friday's action the rally is starting to look quite over-extended and the Nasdaq 100 (NDX) has reached up towards a level at which bearish index traders should be expected to mount a challenge.
As can be seen in terms of the fibonacci grid the index is racing ahead of its rivals in the US having easily surpassed the 62% retracement level for the 1470/1025 grid that I have been using for some time.
There seems to be mounting evidence that the worst of the economic downturn may be behind us, although there is definitely a case of that perennially upbeat analyst Rosy Scenario making a re-appearance, but there are still real doubts about the strength of the recovery. For me the strong "V" shape makes me less confident that the bulls will be able to keep injecting new momentum into the recovery story in the near term.
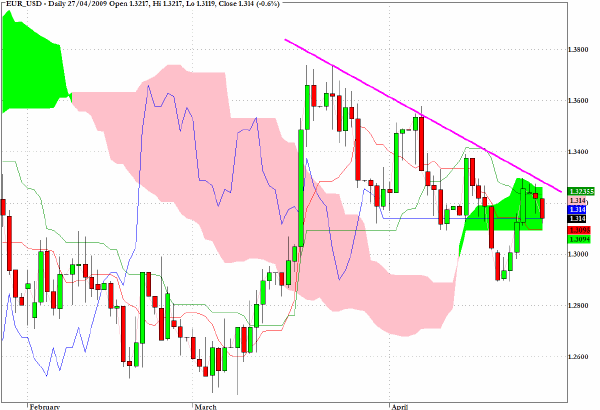
The euro has a distinctive descending wedge pattern through the highs since mid March and its inability to hold on to Friday's gains raises again the bearish implications of falling below the green cloud on the Ichimoku chart.
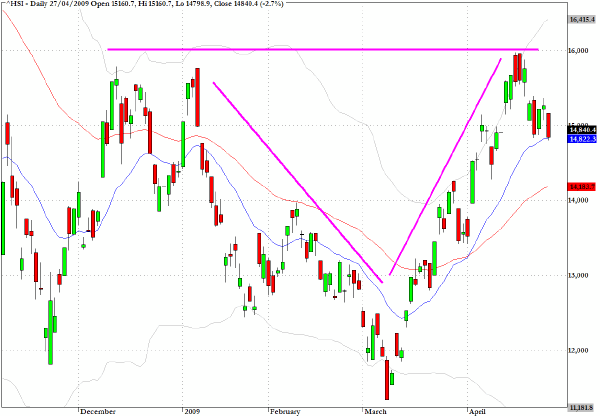
The Hang Seng Index in Hong Kong has encountered the strong resistance as it approached the 16000 level as anticipated here recently. The index slumped back towards the 20 day EMA but could see further erosion back towards the 50 day EMA level in the vicinity of 14200.
This would also have the consequence of violating he very strong upward trendline from the March low which is helping to contribute to the rather disconcerting V shape that has emerged on the chart.
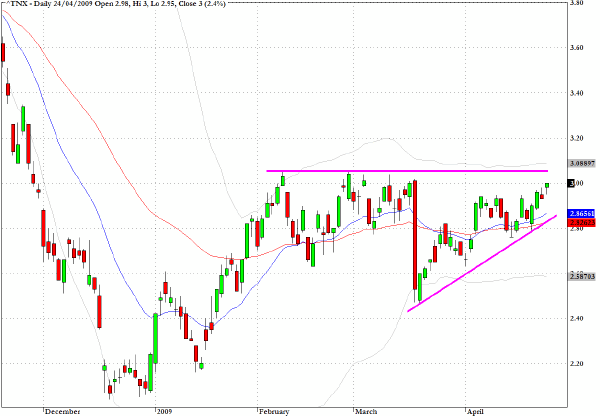
The yield on the ten year US Treasury note closed at exactly 3% on Friday and as I mentioned in Thursday's column one of the warning signals that I believe will be worth monitoring in coming sessions is whether this yield can retreat following some more signals from the Fed that QE is alive and well or whether the global competition for capital, with investors less risk averse now than they were just a couple of months ago, is likely to raise concerns about the vast quantities of sovereign paper that will be issued this year.
On this topic the following story from AP shows that the IMF is now joining the queue to sell bonds to raise the money that was "pledged" at the meeting at the beginning of April in London.
WASHINGTON (AP) -- The International Monetary Fund will sell bonds as a way to raise funds to lend to struggling nations, the head of the organization said Saturday, in a victory for developing countries.
Emerging economies such as China, Brazil and India pushed for the move as an alternative to providing longer-term loans to the IMF. Those countries want a greater voice in the institution before providing additional resources.
IMF Managing Director Dominique Strauss-Kahn said China and other countries have expressed interest in purchasing the bonds. The IMF has never issued bonds before, although the idea was explored in the 1980s.
The move, announced after the IMF's annual spring meeting, indicates the world's leading economies are having difficulty following through on a pledge made in London April 2 to boost an IMF emergency lending facility by $500 billion. The bonds will contribute toward that goal but will provide shorter-term financing than the loans that Japan, the European Union and the United States have promised.
The final paragraph makes clear that one of the alleged positive contributions that arose from the G20 gathering was actually little more than a catchy headline where all of the heavy lifting still has to be done.
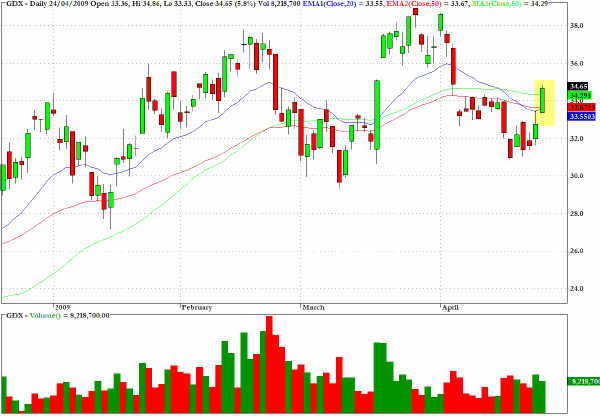
GDX, which provides exposure to the gold mining stocks via an exchange traded fund has registered a rather remarkable chart pattern which has morphed from what was clearly evolving as a bear flag formation during the earlier part of last week into a far more positive pattern with increasing volume as the price moved up by almost six percent in Friday's session and in so doing has moved ahead of key moving averages - including the green line which is the 50 day simple moving average.
Needless to say the picture for the precious metals is itself somewhat confused at the moment and I shall be watching gold and silver this week for further signs that they may be ready to reverse significantly from their recent drift downwards. The potential for an upwards breakout for gold especially remains high.
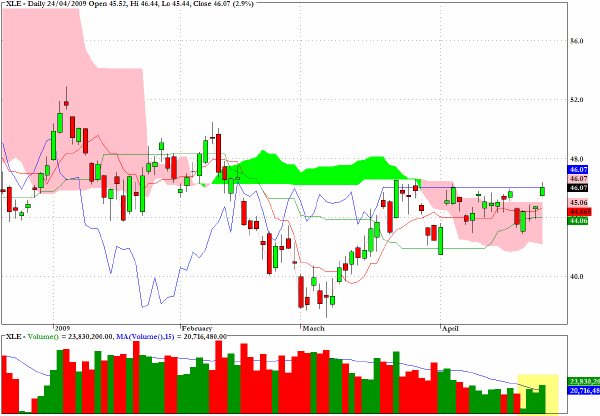
I drew attention the energy sector fund XLE, about a week ago, and once again it is showing further evidence of wanting to move away from the pink cloud on the Ichimoku chart. There is no need to be stepping out with any urgency on the energy stocks as there is still plenty of scope for setbacks, but as the sector rotation strategies being followed by many quant based hedge funds continue to ripple through the market, this is one sector where an upward surprise could appear at short notice.
Clive Corcoran is the publisher of TradeWithForm.com, which provides daily analysis and commentary on the US stock market.
|