|
The Wagner Daily ETF Report For April 27
After starting the week with a sharp pullback, the major indices recovered to close the week mostly higher. Last Friday, stocks posted solid gains, but details of the Fed's financial "stress test" assessment at 2:00 pm ET made afternoon price action jittery. Although the broad market trended higher throughout most of the day, the S&P 500 swiftly plunged 1% following details of the Fed's afternoon announcement. Then, just as quickly, stocks rallied back to their intraday highs. Stocks dipped again in the final fifteen minutes of trading, but the main stock market indexes still logged impressive gains. The Nasdaq Composite powered 2.6% higher, the S&P 500 gained 1.7%, and the Dow Jones Industrial Average rallied 1.5%. The small-cap Russell 2000 and S&P Midcap 400 indices advanced 2.6% and 2.7% respectively. The S&P 500 snapped its six-week winning streak by edging just 0.3% lower, but the Nasdaq scored its seventh straight weekly gain and finished at a new 2009 high.
Total volume in the NYSE was 10% higher than the previous day's level, while volume in the Nasdaq increased 3%. Technically, this enabled both the S&P and Nasdaq to register a bullish "accumulation day." However, a closer look at the intraday volume pattern reveals this to be deceiving. When stocks were trading at their intraday highs, before the afternoon decline, volume in both exchanges was tracking well below the prior day's level. It was only after the swift drop at 2 pm that volume levels jumped and began a pace to exceed Thursday's level by the closing bell. This tells us stocks were rising on lighter volume, and selling off on higher volume. On the contrary to last Friday's volume pattern being bullish, we believe it was actually a stealth day of institutional selling into strength. Since Friday's negative volume pattern followed Wednesday's "distribution day" and Thursday's session of lighter volume gains, underlying institutional activity has not matched the resilient price action of the past several days. Astute traders will see this as a yellow flag going into this last week of the month.
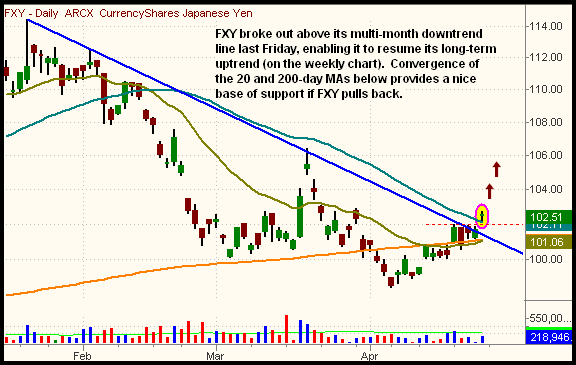
Weakness in the U.S. dollar last Friday enabled PowerShares U.S. Dollar Bearish (UDN) to break out above the upper channel of its month-long downtrend we illustrated in our April 24 commentary. It also enabled CurrencyShares Japanese Yen Trust (FXY) to gap above its multi-month downtrend line and 50-day moving average, thereby triggering our buy entry on the open. With the 20 and 200-day moving averages converging near the low of last week's tight range, a firm base of support may have been established. This is shown on the daily chart of FXY below:

Alongside of the breakouts in several currency ETFs, SPDR Gold Trust (GLD), another ETF we recently pointed out, also broke out above its multi-month downtrend line last Friday. However, it still must contend with overhead resistance of its 50-day moving average. Gold has been quite choppy since beginning its correction in February, but last Friday's break of the downtrend line may lessen the recent indecision and lead to a resumption of its long-term uptrend. If trading the gold (or silver) ETFs, be sure to give your stops a wide enough birth to handle the inevitable shakeouts.
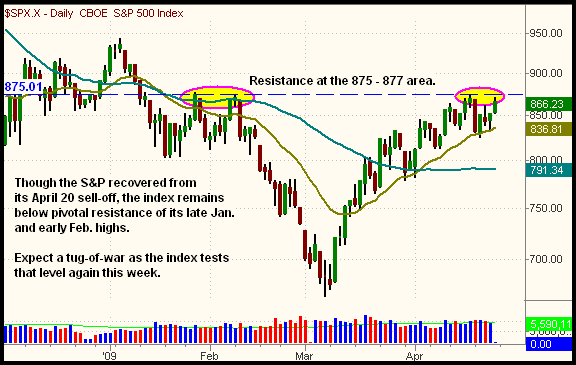
It's bullish that the Nasdaq (marginally) closed the week at a fresh 2009 high, as the lack of recent overhead supply makes it easier for the index to continue higher in the short to intermediate-term. However, the benchmark S&P 500 Index lagged behind last week, and still remains below resistance of its February 2009 high. When the S&P initially rallied into its February high, back on April 17, it sparked a wave of selling that led to a decline of more than 4% the following day. Going into this week, the index is again approaching that key resistance level. This is shown on the daily chart of the S&P 500 Index below:

There is, of course, the possibility that relative strength in the Nasdaq will pull the S&P higher as well. However, with both the S&P and Dow still firmly below their February highs, and volume patterns of the past three days favoring the bearish side, there's a greater possibility the S&P and Dow will weigh on the Nasdaq, causing last Friday's breakout to fail. As we said last week, there remains the possibility stocks will attempt to make another leg higher before significantly correcting from their gains off the March lows. Nevertheless, it would still be much healthier for the market if the major indices retraced down to the area of their 50-day moving averages first; otherwise, any breakout to new 2009 highs runs a much greater risk of failing anyway.
We've been lightly positioned on the long side of the market since the April 20 sell-off, as we expected further correction in the near-term. We also did not want to be heavily loaded up while smack in the middle of corporate earnings season. But if the stock market proves us to be wrong, and the major indices surge above their February highs without pause, our egos are not too big to simply jump back in the long side of the market. Our continual focus is on trading what we see, not what we think! Right now, we see mixed signals; hence the light positioning until the market shows its hand for the direction of its next move.
Open ETF positions:
Long - FXY, SDS, FXP
Short - (none, but SDS and FXP are inversely correlated ETFs)
Deron Wagner is the Founder and Head Trader of both Morpheus Capital LP, a U.S. hedge fund, and MorpheusTrading.com, a trader education firm.
|