Charles River Laboratories (CRL) has a bearish pullback pattern which is facing overhead resistance from two key moving averages.
The long-standing 875 target which I have been talking about for several weeks was more or less achieved on the S&P 500 (SPX).
Is the next stop 935 or 850?
Given the current manic enthusiasm for equities where all news is being interpreted positively the odds favor a rally continuation. However, a period of consolidation would be more constructive.
My discussion yesterday about the 30-year T Bond yield proved timely as the long end of the yield spectrum saw some big upward moves with the 10-Year Note moving up to close with a 3.1% yield and the 30 Year Bond moving above 4% for the first time since last November. In general terms what is becoming disconcertingly clear (from a budget financing perspective) is a fading appetite for US government securities amidst the massive supply and the re-allocation decisions being made by fund managers as they venture away from their safe harbor holdings of the last few months. 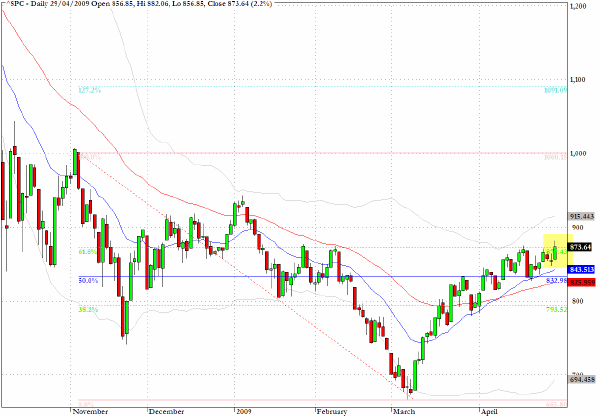
The Nasdaq Composite (IXIC) has moved decisively above the January 6th high and the 62% retracement level on the grid indicated on the chart. The next upside target would be the November 4 closing high level of 1780. 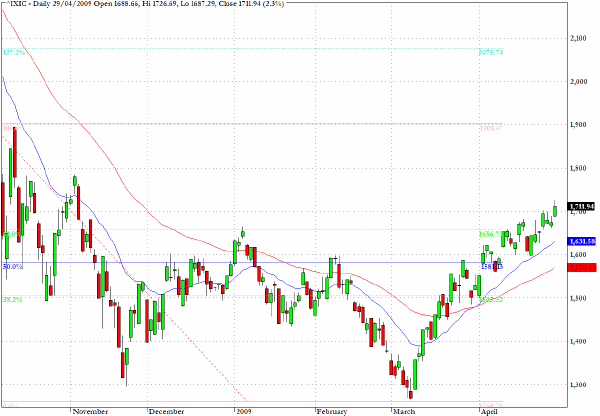
The ETF, UUP, which tracks the US dollar against a basket of currencies, is losing contention with the green cloud on the Ichimoku chart.
A bearish play on the dollar is available via the inverse exchange traded fund UDN. 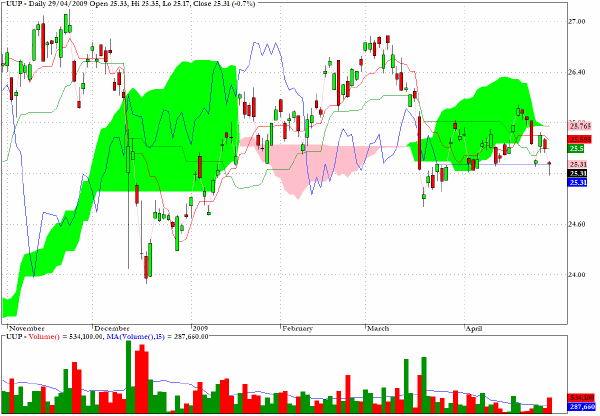
I'll repeat my comments from yesterday regarding the concerns at the long end of the Treasury complex.
TLT, tracks the longest maturity Treasury bond prices, and as the ETF chart which tracks the price of 20 year plus instruments indicates this is where the most weakness is being felt in the sector.
For non-specialists in fixed-income mathematics (which includes myself) who do not have access to a more sophisticated modeling tool, Excel has a simple function to assess what would happen to prices in the secondary market for a 30-year bond with a current coupon on it, if the yield to maturity has to rise to reflect weak demand, high inflation or increasing skepticism that there is the political will to ever pay off the public sector debt - or, as could be the case, all three of those taken together.
Details of how to use this function to calculate what the secondary market value for a 30-year Treasury issued soon with a 4% coupon but which had to effectively yield (say) 8% to maturity can be found at my blog site. 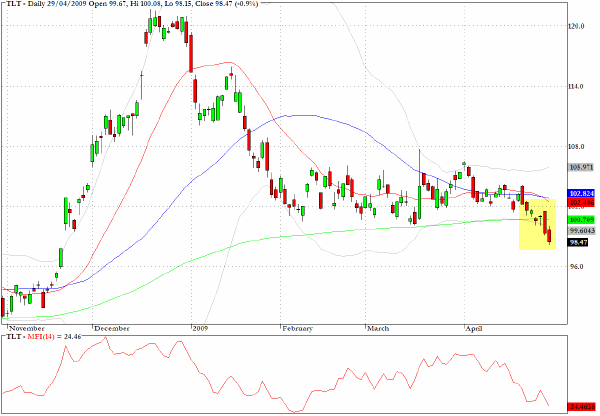
Yum Brands (YUM) has a bullish flag pattern and could be headed towards the $38 level. 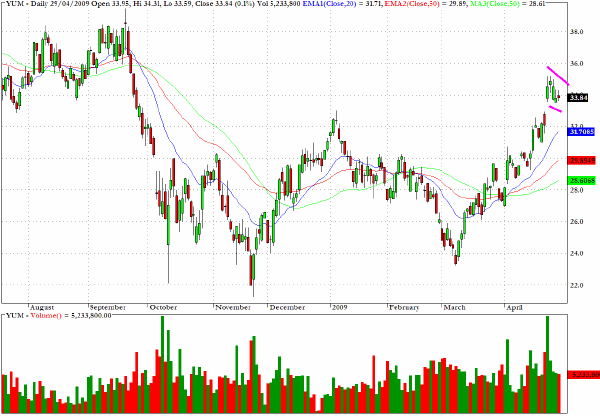
Tellabs Inc (TLAB) has an inside day pattern following a heavy volume doji star and the MACD chart suggests a waning of momentum. This would be worth monitoring for an entry on the short side. 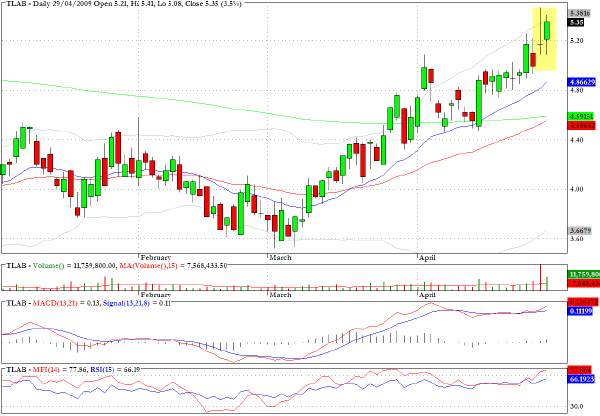
Charles River Laboratories (CRL) has a bearish pullback pattern which is facing overhead resistance from two key moving averages. 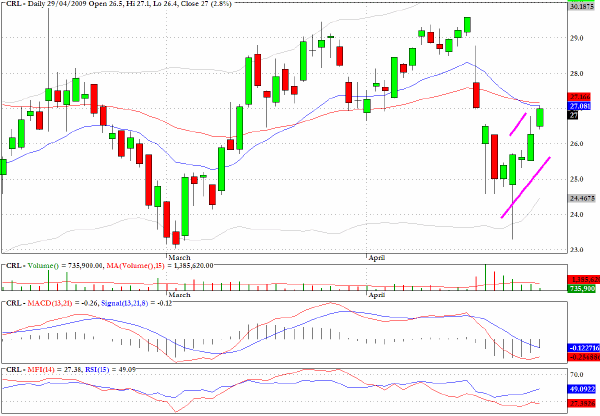
China Finance Online (JRJC) has a positive pullback formation with bullish volume characteristics. 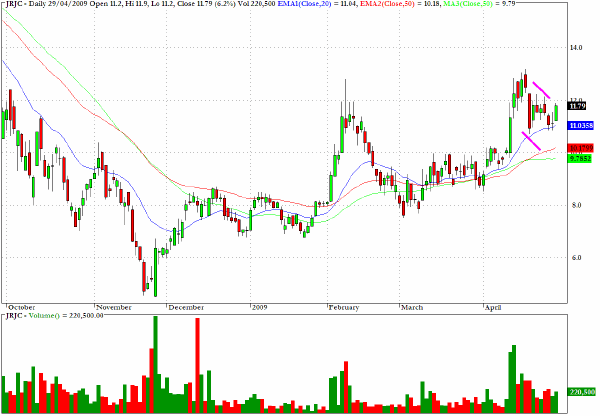
Clive Corcoran is the publisher of TradeWithForm.com, which provides daily analysis and commentary on the US stock market.