|
The Wagner Daily ETF Report For April 30
After gapping higher on the open, the major indices climbed steadily, at least until the afternoon Fed announcement on economic policy. Immediately thereafter, stocks exhibited the usual, erratic post-Fed price action before surrendering a chunk of their intraday gains into the close. Nevertheless, the main stock market indexes still finished with gains of more than 2%. The Nasdaq Composite jumped 2.3%, the S&P 500 2.2%, and the Dow Jones Industrial Average 2.1%. The small-cap Russell 2000 raced 3.9% higher, as the S&P Midcap 400 advanced 2.8%. The S&P 500, Dow Industrials, and Nasdaq Composite closed near the upper third of their intraday ranges.
Turnover swelled across the board, enabling both the S&P 500 and Nasdaq Composite to score a bullish "accumulation day." Total volume in the NYSE increased 18% above the previous day's level, while volume in the Nasdaq rose 13%. Although institutional buying was prevalent, volume in the NYSE still failed to exceed 50-day average levels. However, market internals were solid. In the NYSE, advancing volume beat declining volume by more than 7 to 1. The Nasdaq adv/dec volume ratio was positive by nearly 4 to 1.
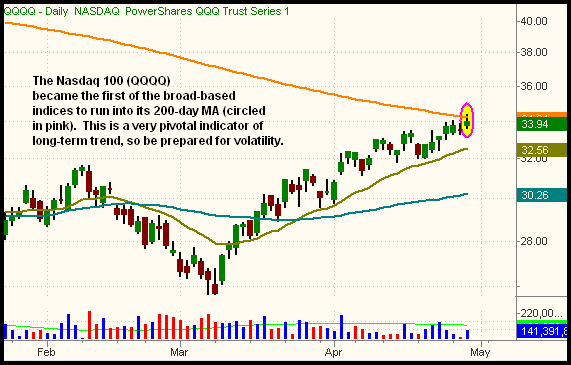
Yesterday, the Nasdaq 100 Index ($NDX) became the first of the major indices to reach its 200-day moving average (MA). The index bumped into that key indicator of long-term trend on an intraday basis, then settled to close just below it. It was the first time since September of 2008 the Nasdaq 100 touched its 200-day MA. Below, this is illustrated on the daily chart of PowerShares QQQ Trust (QQQQ), a well-known ETF proxy of the Nasdaq 100 Index:

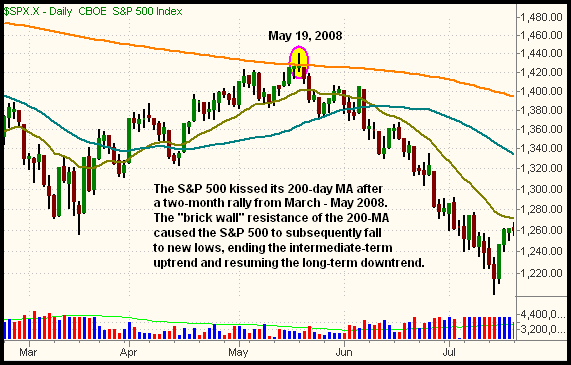
While hedge funds, mutual funds, and other institutions frequently view the 50-day MA as a reliable indicator of intermediate-term trend, the 200-day MA is viewed as a pivotal indicator of long-term trend. As such, the 200-day MA often acts like a brick wall resistance level that stops rallies dead in their tracks (if approached from below), or provides rock-solid support (if price is caught from above). Rarely will an index, stock, or ETF blast through its 200-day MA on the initial attempt. Rather, the first test of the 200-day MA usually triggers a pullback before the price makes another attempt at breaking through the 200-day MA. In many cases, the 200-day MA even marks the end of an intermediate-term, countertrend bounce, and causes the dominant, long-term trend to resume. This is what happened with the S&P 500 Index, back in May of 2008. Take a look:

After trending lower from October 2007 through March 2008, the S&P 500 reversed to enter into an intermediate-term, countertrend bounce. From March 2008 through May 2008, the S&P 500 settled into an intermediate-term uptrend, lending hope to the bulls. But when the index ran into the initial test of its 200-day MA on May 19, that marked the absolute end of the intermediate-term rally. Less than two months later, the S&P 500 fell below its March 2008 low, technically resuming the long-term downtrend that began with the October 2008 high. The S&P 500 has been trading well below its 200-day MA ever since.
Like the S&P 500 on the chart above, the Nasdaq 100 is presently in an intermediate-term uptrend, within the context of a long-term downtrend. However, we are NOT implying this first touch of the 200-day MA will cause the Nasdaq 100 to reverse to new lows, as it did with the S&P 500 last year. Still, it's very important to be aware of the power of this moving average as an indicator of support or resistance -- the S&P 500 chart above is just one of countless instances where the 200-day MA acts like a brick wall.
More commonly than immediately leading to a resumption of the dominant trend direction on the first test, the 200-day MA will usually be probed several times. On the first touch, it's even common for the price to close above the 200-day MA for a day or two before pulling back to subsequently try again. But regardless of whether the 200-day MA triggers a major reversal lower, or merely leads to a pullback, it would indeed be quite unusual if the Nasdaq just blasts through its 200-day MA without looking back. With the Nasdaq being the first index to reach its 200-day MA from below, and other indexes approaching as well, we're about to find out whether the current rally off last month's lows is sustainable. It's not a bad time to lay low, maintaining a large cash position until the market makes up its mind.
Open ETF positions:
Long - FXY, QID
Short - (none, but QID is inversely correlated)
Deron Wagner is the Founder and Head Trader of both Morpheus Capital LP, a U.S. hedge fund, and MorpheusTrading.com, a trader education firm.
|