| The Wagner Daily ETF Report For May 4 |
| By Deron Wagner |
Published
05/3/2009
|
Stocks
|
Unrated
|
|
|
|
The Wagner Daily ETF Report For May 4
Stocks kicked off the month of May with a choppy, uneventful session of trading last Friday, though the Nasdaq secured its eighth straight weekly gain. The major indices opened near the flat line, then oscillated in a directionless, sideways manner throughout the entire day. A late-day push in the final thirty minutes of trading enabled most of the main stock market indexes to finish modestly higher. The S&P 500 and Dow Jones Industrial Average logged identical gains of 0.5%, as the Nasdaq Composite ticked just 0.1% higher. Small and mid-caps took a breather. The Russell 2000 and S&P Midcap 400 indices dipped 0.1% and 0.4% respectively. The S&P and Dow finished near their intraday highs, but the Nasdaq closed just above the middle of the day's range.
Turnover eased across the board, causing trading in both the NYSE and Nasdaq to dip back below 50-day average levels. Total volume in the NYSE was 25% lighter than the previous day's level, while volume in the Nasdaq receded 23%. In both exchanges, advancing volume fractionally exceeded declining volume. Overall, it was a lethargic, lackadaisical session.
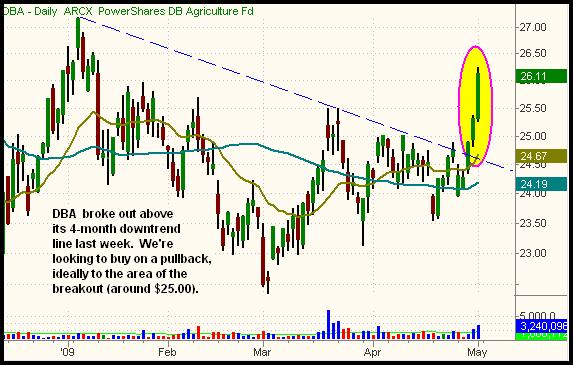
Unlike most ETFs that are comprised of individual stocks, PowerShares Agriculture Fund (DBA) is a commodity ETF whose holdings consist of corn, soybean, sugar, and wheat futures contracts. While many industry sectors were flat to modestly higher last week, DBA outperformed with a 5.5% gain. More importantly, it broke out above resistance of a four-month downtrend line. Higher than average volume over the past two days helped confirm the breakout. This week, we're monitoring DBA for potential buy entry on a pullback, ideally to near the area of its breakout level. The daily chart of DBA is shown below:

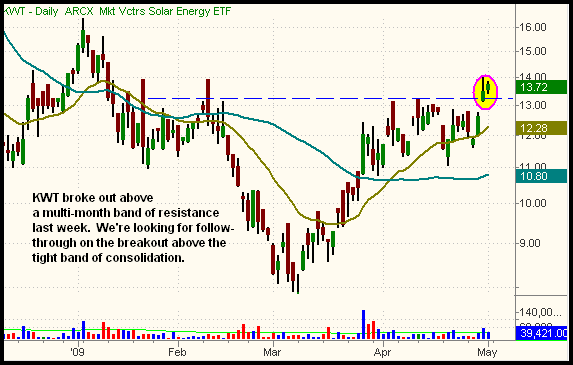
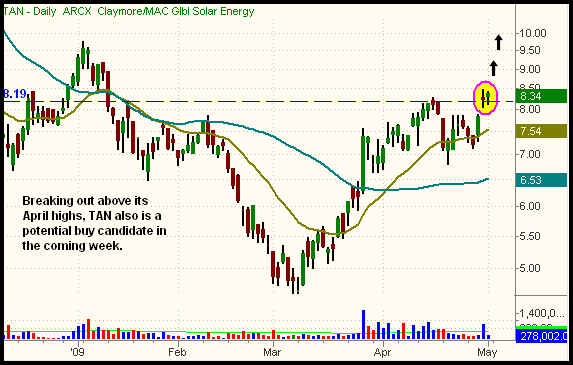
On April 30, leading solar energy player First Solar (FSLR) announced quarterly earnings that impressed Wall Street, causing the stock to subsequently gap 23% higher in the following session. This also had a positive effect on the entire clean energy sector and associated ETFs. This week, we're looking for follow-through strength in solar energy, which should lead to breakouts in several related ETFs. Specifically, we're monitoring Market Vectors Solar Energy (KWT) and Claymore Global Solar Energy (TAN) for possible breakout entries. The daily charts of both ETFs are shown below:


Last week, we pointed out the Nasdaq 100 and Nasdaq Composite indices became the first of the major indices to run into "brick wall" resistance of their 200-day moving averages. Whether or not this will lead to a substantial pullback this time around remains to be seen, but the 200-day MA resistance definitely remains a technical point of contention to be aware of this week. But regardless of whether or not we see a pullback, after eight consecutive weeks of gains in the Nasdaq, the overall risk/reward for new buy entries in the broad-based ETFs is not that favorable at current levels. There are select ETFs to be considered on a breakout, such as KWT and TAN above, but most of the setups we're stalking require pullbacks to key support levels, such as their 20 or 50-day moving averages. As those strong ETFs begin to retrace, or at least consolidate for a few weeks, we'll be looking for new buy entries on the subsequent trend resumption.
Open ETF positions:
Long - SKF, QID, FXY
Short - (none, but SKF and QID are inversely correlated)
Deron Wagner is the Founder and Head Trader of both Morpheus Capital LP, a U.S. hedge fund, and MorpheusTrading.com, a trader education firm.
|