Clive Corcoran remains in the bear market rally camp, but is also not playing the short side of the market.
The S&P 500 surged ahead yesterday breaking through the 900 level and seems ready to challenge the intraday high of the year at 943.85 achieved on January 6, 2009.
The market seems to be barely able to contain its enthusiasm at the moment and with a growing chorus of pundits claiming that a new bull market has been born we could be headed to the 1000 level sooner than would have seemed imaginable just two months ago.
I have to confess that I remain in the bear market rally camp, but I’m also not playing the short side of the market until the evidence suggests that the golden goose is thoroughly cooked. I sense that the mania which is creating the parabolic slant to the right hand stroke of the "V" formation on so many charts is looking increasingly unsustainable in the near term.
There is a very interesting comment about the remarkably high correlation between different sectors in the equity markets available here.
The average systemic correlation across stocks is at near all-time highs, exceeded only by the days following the October 1987 crash and a brief period in 1954. We measure this “implied correlation” as the correlation among a portfolio of stocks, where we assume the correlation is constant for each pair of stocks. In other words, implied correlations are the values one gets from doing portfolio math and ascertaining what the dispersion is among stocks within that grouping. A high correlation means that there is very little dispersion among the stocks and a low correlation means that there is high dispersion in performance. Today there is very little dispersion when measured in stocks across the market as a whole. Systemic factors are driving stock returns across the market. Stock specific news is largely irrelevant and that this is the case in the middle of earnings season, when stock specific news should be at its height, is truly remarkable.
I have discussed my own views about extremes in correlation in this column and also in Long/Short Market Dynamics. In essence it usually appears in conjunction with extremes in market coherence and also can be a precursor to sudden seize-ups in liquidity. Let’s see how much more extreme these readings can become.
Clearly this market is showing some unusual dynamics and many quant relative value funds are losing large sums of money as their dispersion bets and long/short strategies are proving to be "inoperative" at the moment. 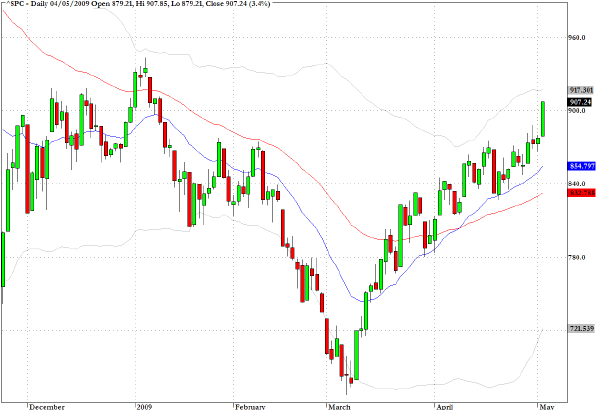
After a 5.5% advance in Monday’s trading, the Hang Seng Index in Hong Kong (HSI) registered a rather interesting candlestick formation, at the completion of Tuesday’s session in Asia, which is known as a hanging man. At a new multi-period high this can often be construed as a potential inflection point. 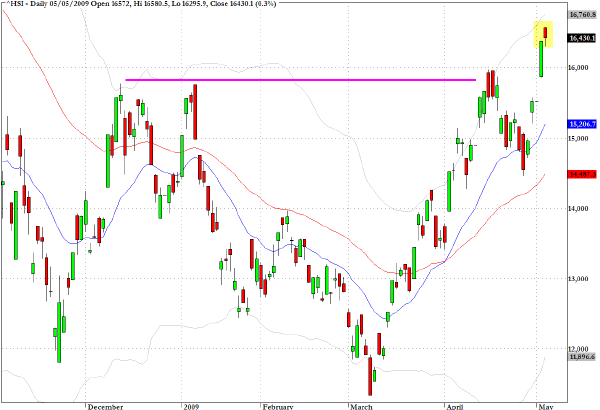
The exchange traded proxy for the Russell 2000 (IWM) reveals that the index has reached almost exactly the level seen on January 6 and also the 200-day EMA. I would suggest that caution is in order at these levels but maybe I’m just not seeing the opportunity for further substantial advances. 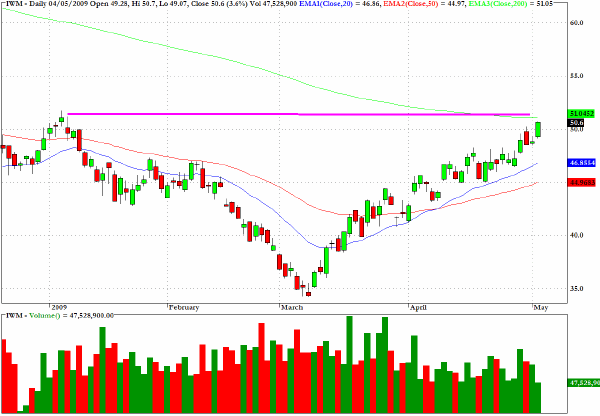
Last Thursday I noted that China Finance Online (JRJC) had a positive pullback formation with bullish volume characteristics. The stock was a standout performer yesterday with a 15% gain on the session. 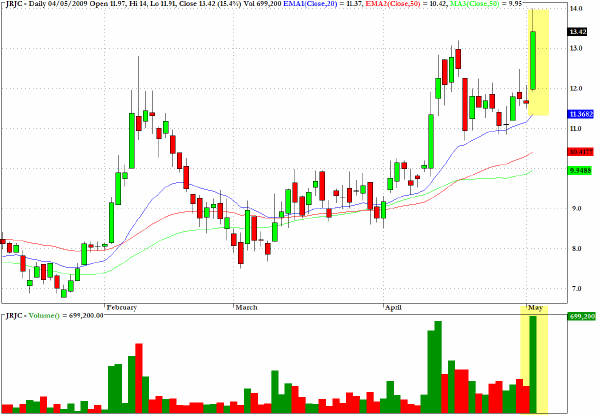
The exchange traded fund the KBW Banking Index (KBE) put in a rather stunning performance yesterday with a gain of 14.5%. Everyone appears to be convinced that the worst is over for the banks and that the Q1 earnings statements released a few weeks ago by the major banks can act as an indication that over the longer term the so called legacy assets that are still sitting on the balance sheets for the sector will be nursed gradually back to health.
Central bankers now openly admit that the world’s banking system stared at the abyss in mid-October but seven months later and after several trillion dollars of public sector (taxpayer) support all seems to be ok again. Let’s hope so. 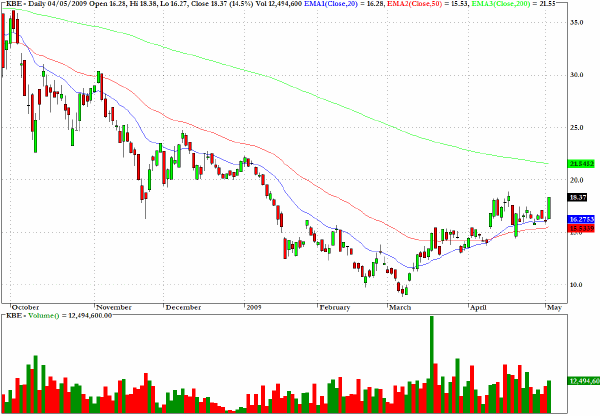
HYG, one of the ETF’s which tracks the high yield corporate bond market, has reached an area of potential chart resistance and has posted three red, narrow range, candlesticks in succession. 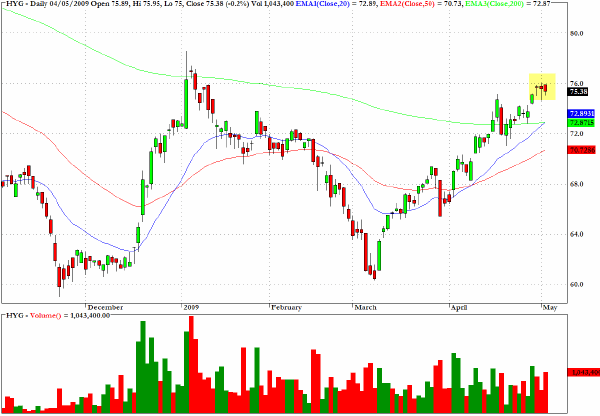
Clive Corcoran is the publisher of TradeWithForm.com, which provides daily analysis and commentary on the US stock market.