| Corcoran Technical Trading Patterns For May 6 |
| By Clive Corcoran |
Published
05/6/2009
|
Stocks
|
Unrated
|
|
|
|
Corcoran Technical Trading Patterns For May 6
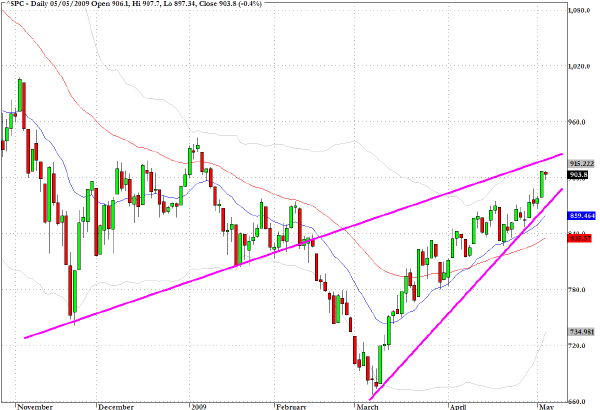
It was an unusually quite but erratic session of trading yesterday, perhaps largely in response to Chairman Bernanke's testimony. Many tiny range candlesticks resulted including, this hanging man pattern which arose on the daily chart for the S&P 500 (SPX).
I shall not re-state the exact reasoning behind my hypothesis involving the similarity between the rising wedge patterns observed last April/May on this index and the pattern evolving this year in the same time frame. All I will say is that I believe that as the index moves further into the apex of this wedge I believe that the likelihood of a sudden and abrupt drop is increasing.
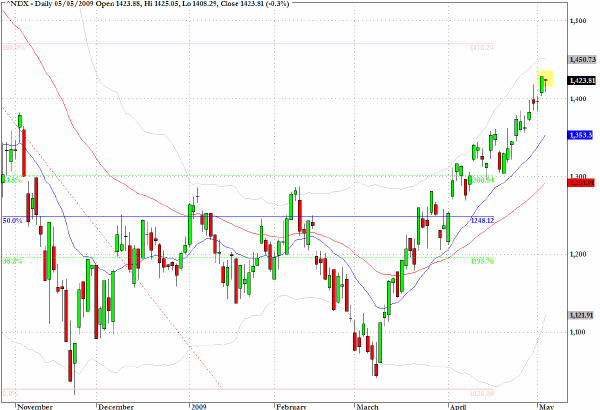
The Nasdaq 100 (NDX) registered an unusual pattern which could be described as a doji hanging man as it had the characteristics of both formations. It was also an inside pattern.
The 1470 level, which was the intraday high from October 14, 2009, is the target that I set several weeks ago in terms of the upper level to the fibonacci retracement grids I was using during April.
This level still seems to be a key threshold for the bulls and a sharp upward move towards this level could be the kind of blow-off event that might suggest that the current rally is close to completion.
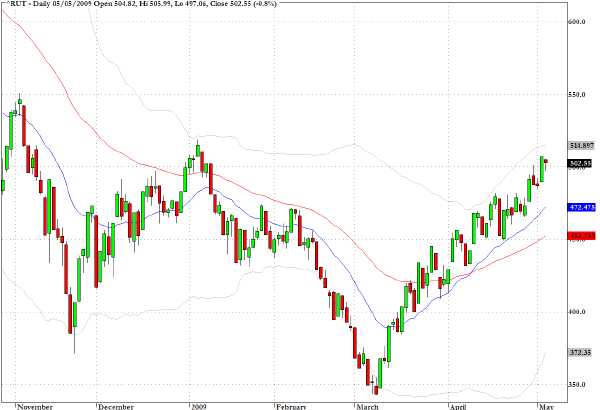
The Russell 2000 (RUT) also produced another hanging man pattern in conjunction with Monday’s move towards a new 2009 high.
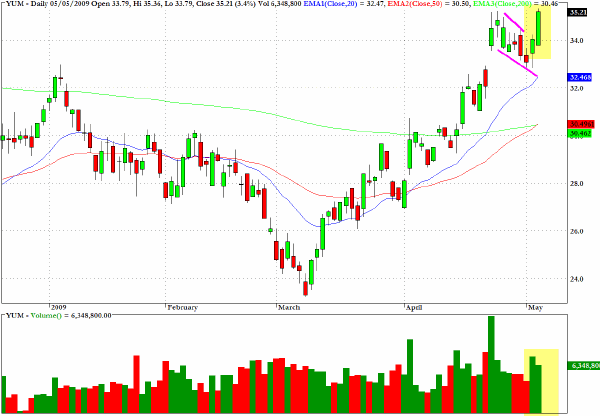
Last week. I commented on Yum Brands (YUM) which was developing a bullish flag pattern and yesterday's upward surge could have further to run.
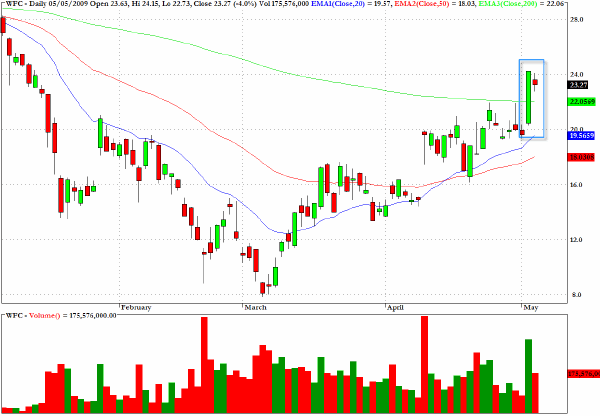
Wells Fargo (WFC) recorded a tiny inside doji pattern after having moved up its 200-day moving average in Monday's session.
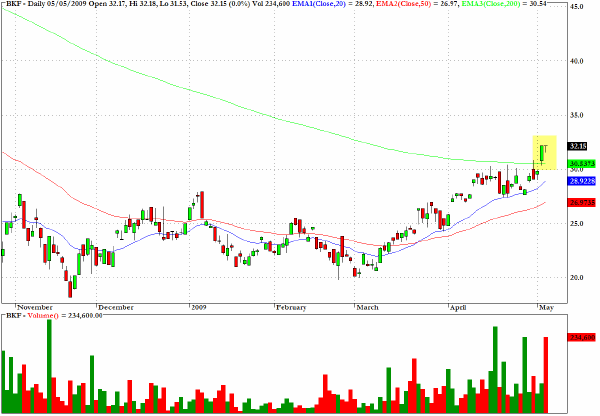
The MSCI Bric fund, BKF, registered, in remarkable similarity to the pattern on the Nasdaq 100, another doji/hanging man pattern just above its 200-day EMA.
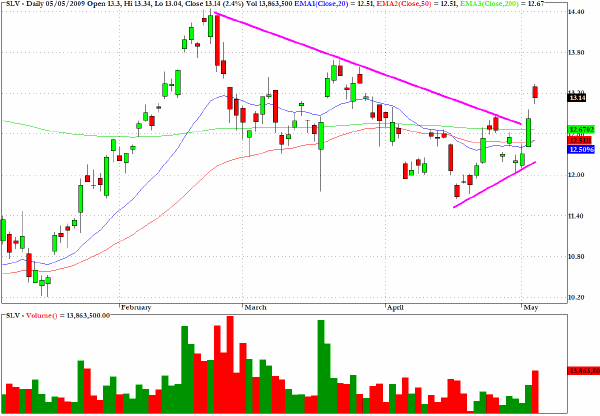
The chart for SLV, which is the exchange traded fund for silver, shows the difficulties of trading the precious metals complex at present.
Monday's break out from the triangular pattern was not accompanied by the kind of volume that one would have wished to see (possibly suggesting a fake-out) and the reversal pattern yesterday on much higher volume raises further questions about the near term direction.
Clive Corcoran is the publisher of TradeWithForm.com, which provides daily analysis and commentary on the US stock market.
|