| Corcoran Technical Trading Patterns For May 7 |
| By Clive Corcoran |
Published
05/6/2009
|
Stocks
|
Unrated
|
|
|
|
Corcoran Technical Trading Patterns For May 7
The leaks first thing yesterday regarding the stress tests and how they would impact on Bank of America (BAC) are a wonderful example of good spinning (whether by design or by accident).
The first reports were greeted with a bout of selling in the pre-market and lots of earnest bloggers ready to tell their followers that maybe Armageddon was back on the agenda. After some further percolations through the blogosphere and CNBC etc. it now appears that the news is a positive for BAC as the bank has already raised most of the capital it needs- and through a wonderful sleight of hand involving the way that Tangible Common Equity [TCE] is actually measured - the stock is now moving up.
Confusing... that was the whole point.
The essence of good spin is that the signal / noise ratio is calibrated to create the maximum ambiguity. Then the markets are tricked into believing that they have not, in fact, already discounted the news appropriately.
Whether they then go on to discount it appropriately is a different matter and can take a lot longer to manifest itself.
The big concern of course is whether those doing the spinning are as clever as they appear and whether they really know what’s going on.
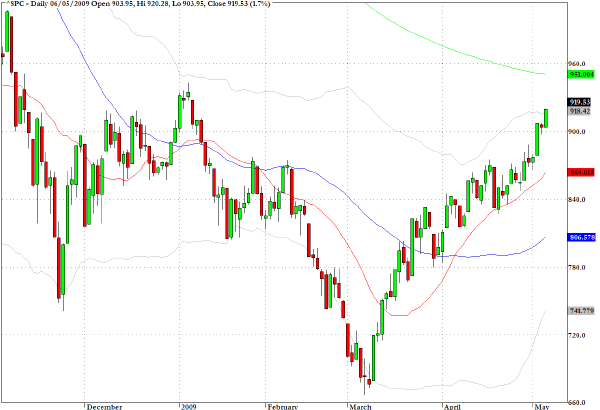
Meanwhile, the S&P 500 continued its ascent. Two overhead levels to keep on the radar in the next few sessions - 935-40 which coincides with the January 6 level and the 950 level which coincides with the 950 level.
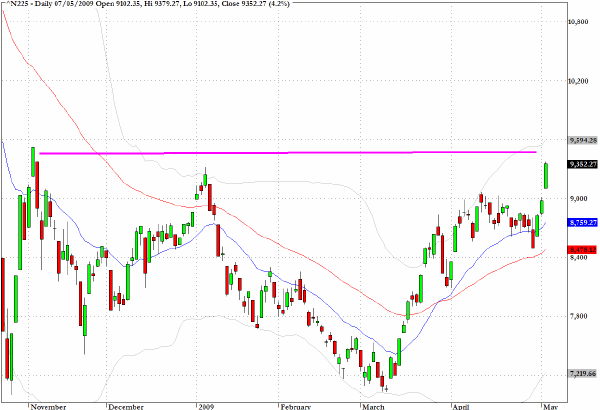
The Nikkei 225 (N225) reopened for trading on Thursday after several days of being closed for holidays. The market had some catching up to do and added 4.2% and appears to be close to some overhead resistance in the neighborhood of 9600.
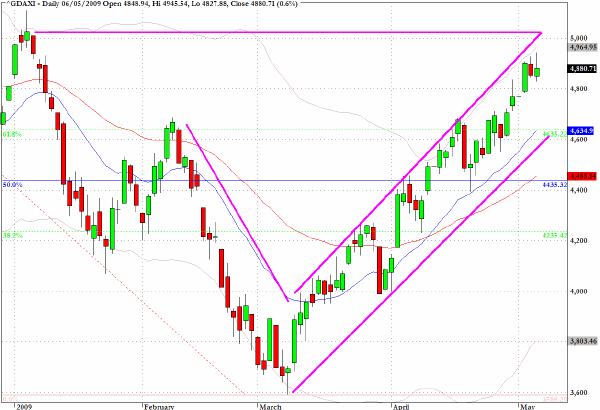
The DAX in Germany is approaching the 5000 level which was seen in early January. This chart, along with so many others at present, depicts an unusually pronounced buy channel which suggests that traders are now confident that the economic downturn had already been fully factored in early March.
Some asset allocators have been sitting on their hands during much of this run-up and the bullish cheerleaders are now suggesting that the next leg of this upturn, when big institutions commit funds to this, will be the final confirmation that we are entering a new bull market.
If those sitting on the sidelines are still not convinced that it is time to commit, do the bulls still have sufficient fire-power to keep this rally going?
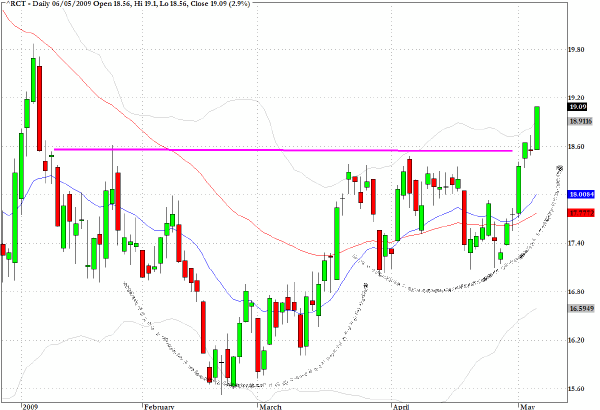
A broad-based index of commodities (RCT) is revealing a cup and handle formation which often precedes a major bullish breakout.
The ECB is widely expected to reduce its key short-term rate by another 25 basis points when it meets in Frankfurt later this morning. This would take rates to their lowest in the 10-year history of the Eurozone currency union and some will be looking for any evidence that Mr. Trichet has any nonconventional policy initiatives up his sleeve.
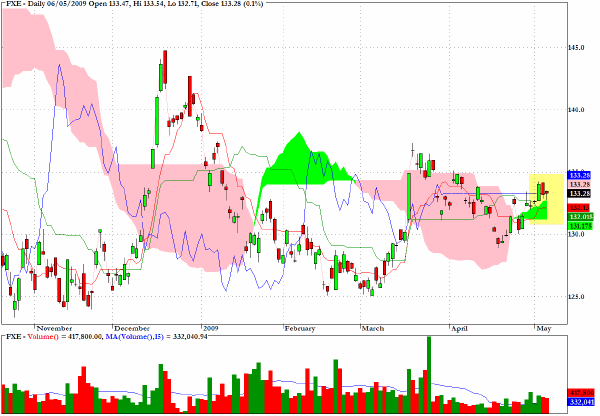
The ETF which tracks the euro, FXE, shows that the currency has moved in and out of the pink cloud without failing to make substantial progress and now on the right hand side of the Ichimoku chart the possibility is developing that the currency could now slide into the green cloud. If it continues to slide through the cloud, this would be a bearish signal for the currency.
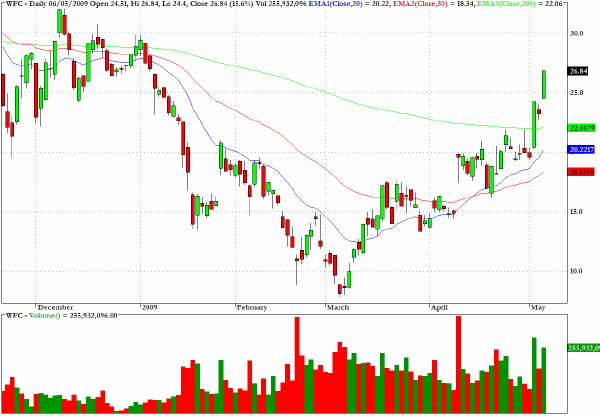
Wells Fargo (WFC) has now decisively pushed above its 200-day EMA and seems to be on its way to a test of chart resistance at the $30 level.
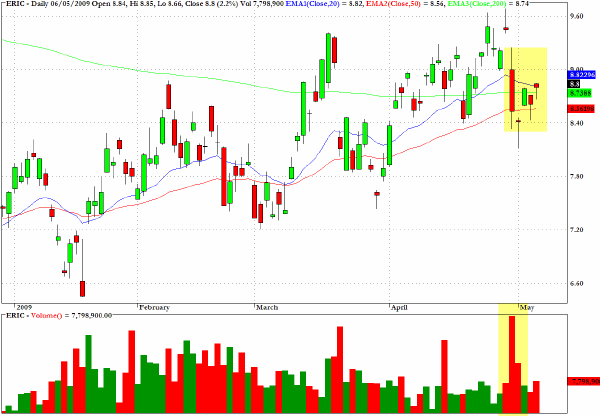
Ericsson (ERIC) has a bearish flag formation with the appropriate volume characteristics.
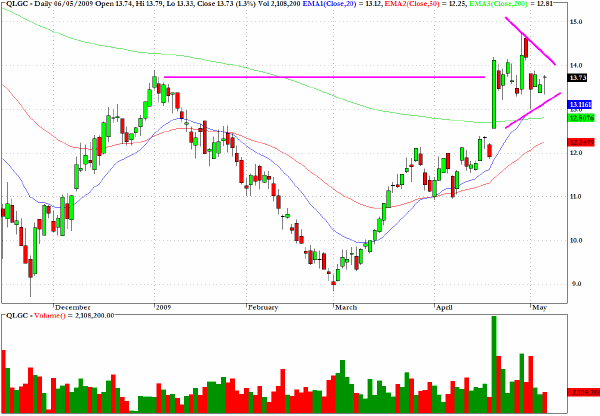
QLGC has a bullish pennant formation and the volume pattern is pointing to a breakaway potential in coming sessions.
Clive Corcoran is the publisher of TradeWithForm.com, which provides daily analysis and commentary on the US stock market.
|