| Corcoran Technical Trading Patterns For May 8 |
| By Clive Corcoran |
Published
05/8/2009
|
Stocks
|
Unrated
|
|
|
|
Corcoran Technical Trading Patterns For May 8
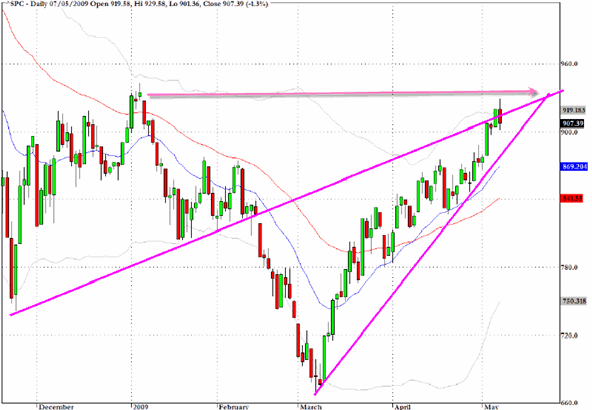
The S&P 500 (SPX) is still within the rising wedge pattern and on my prolongation of the formation there is an interesting coincidence looming at the level of 935/940 as indicated by the arrow drawn.
I remain very cautious at this point and sense that the market is quite lopsided on the bullish side with a number of Johnny come lately fund managers, who are not entirely convinced that they should be buying lots of equities, but also don’t want to fall behind the benchmarks and their peers.
It would not take too much to cause them to consider a quick exit if concerns continue to mount about financing the deficit with Treasuries that seem to be requiring higher coupons, on an almost daily basis, and certainly much higher than most thought would be necessary late last year.
After all of the shenanigans with the stress tests behind us (?) the market now has to contemplate today’s employment report which, in the strange Alice through the looking glass world we are entering, could be bad news for bonds, (relative) good news for those who were spared a redundancy notice and as for stocks? - well it isn’t obvious how much traders have yet decided whether it is a strong or weak recovery which they want.
My overall point is that we are approaching a scenario where too much good news for stocks will actually be a cause for concern due to the rising costs of refinancing mortgages, servicing budget deficits and other asset-backed debt, and this may start to look just a little more horrendous than it did when ten-year rates were around 2.5%.
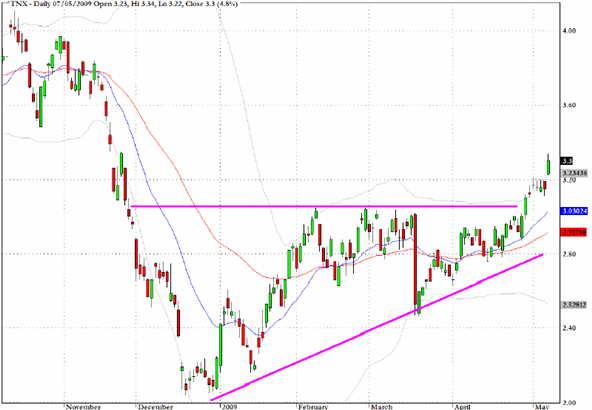
Yields on the ten-year US Treasury note have moved above 3.25% and the chart formation on yields would, if transposed to price, resemble the descending wedge patterns that were very much in evidence on all equity indices last fall.
This is not good news for Bill Gross at PIMCO etc., and one could imagine him checking in frequently with Larry Summers and Dr. Bernanke as to how the QE program is progressing. One could even imagine him suggesting that perhaps the Fed (or is it the Treasury - sorry to seem confused on this key point) should be buying more Treasuries from themselves.
Either way it requires a mental stretch to see an arms-length basis here, which is a usual requirement for a sound (and legal) commercial transaction.
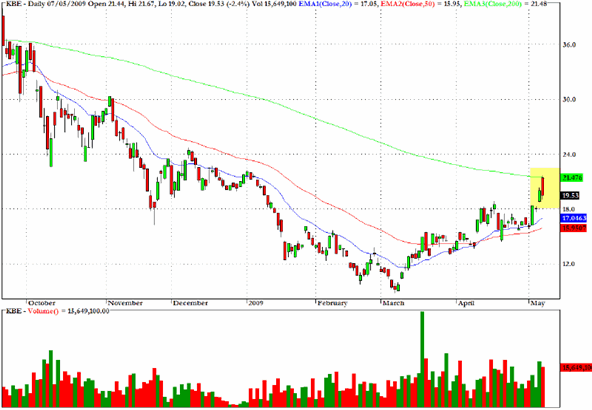
The exchange traded fund the KBW Banking Index (KBE) ran into resistance at exactly the 200-day EMA and may have to retrace its steps somewhat, but the underlying dynamics favor the bulls in this sector.
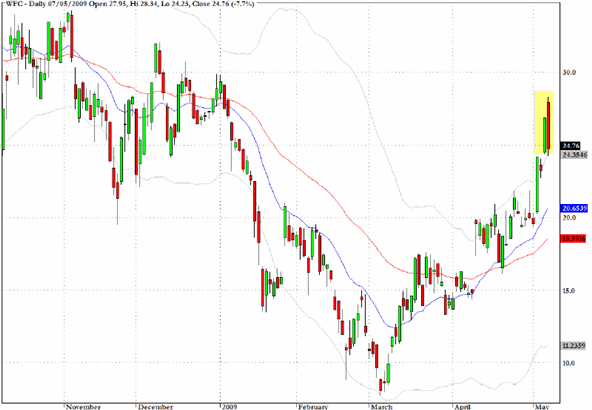
Wells Fargo (WFC) pushed up towards the $30 target discussed here yesterday but ran into a bout of selling causing a large reversal candlestick.
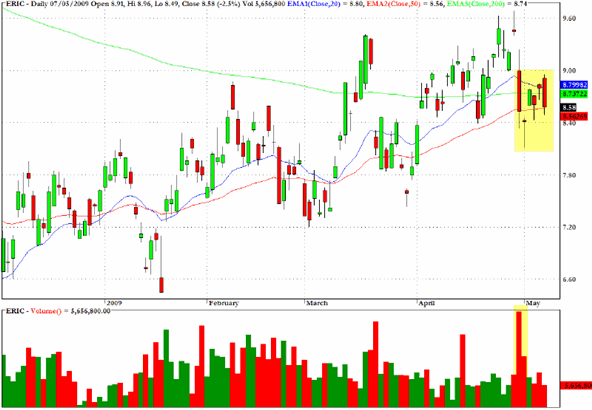
Once again I will point to Ericsson (ERIC) which has a bearish pullback pattern and looks vulnerable to further selling.
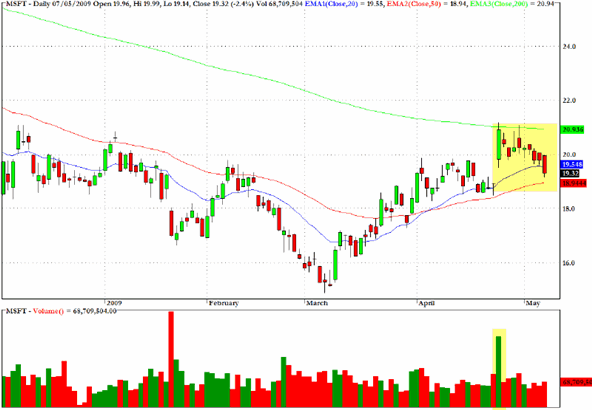
Microsoft (MSFT) has evidence of a bullish flag pattern with entry opportunities close to moving average support.
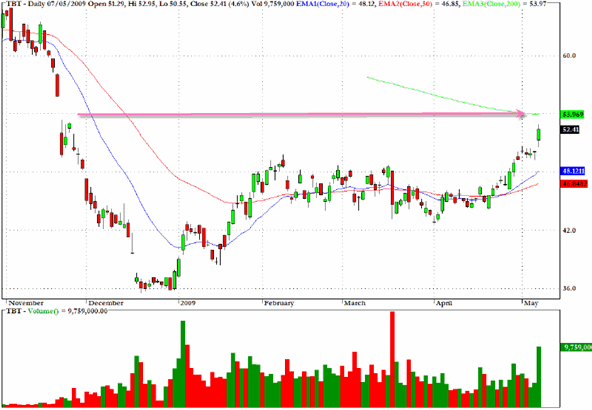
Moving slightly further out on the yield spectrum to the 20-plus-year securities, the exchange traded fund, TBT, moves inversely and with twice leverage to price. In other words it rises with yields and provides a leveraged kicker as well.
The chart reveals a significant threshold to cross at this point with overhead resistance from the 200-day EMA, and also evident on the left hand side of the chart are the large gaps down in yield in late November.
Clive Corcoran is the publisher of TradeWithForm.com, which provides daily analysis and commentary on the US stock market.
|