Our indicators continue to remain bullish, although some are seriously overbought. The broad market rally seems to show little sign of slowing down, even though it has reached a rather frothy level, with $2 stocks bounding higher all over the board.
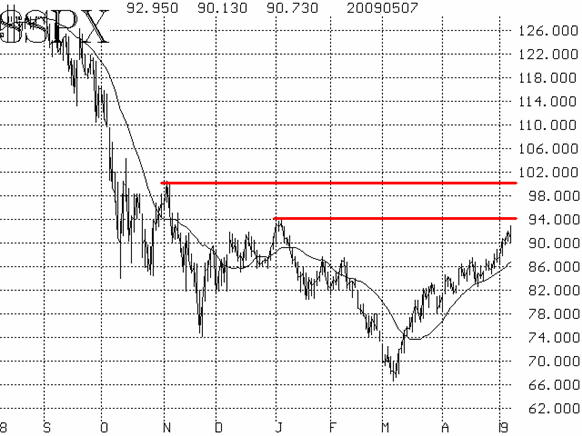
$SPX broke out over resistance at the 875-880 level this week. Having accomplished that, the next areas of resistance are the January highs at 940 and then the highs of last October at 1000. Today, $SPX reached the 930 level before falling back sharply in an overbought correction. So, for now, the 930-940 area represents overhead resistance. On the downside, the 875-880 area should now represent support, as does the 20-day moving average (currently near 870).

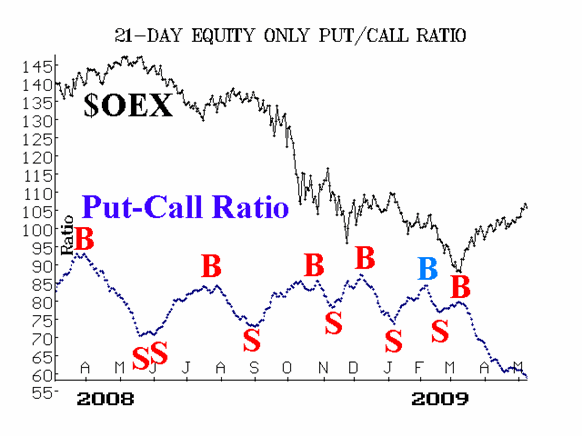
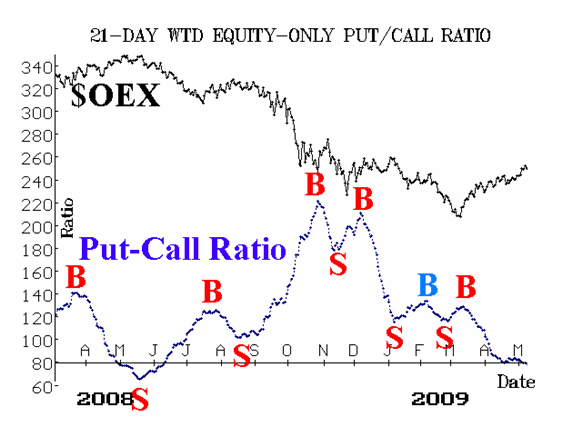
The equity-only put-call ratios had been fooling around with sell signals last week, but now they have broken down to new lows. That reconfirms buy signals for these indicators. They are overbought by the fact that they are low on their charts, but as long as they continue to decline, they remain on intermediate-term buy signals.

Market breadth has been extremely strong and is overbought. That is actually bullish, for it means that the advance is broad-based. This overbought condition has persisted for quite a while, and generally that indicates that the current rally is just the beginning of a larger intermediate-term move.

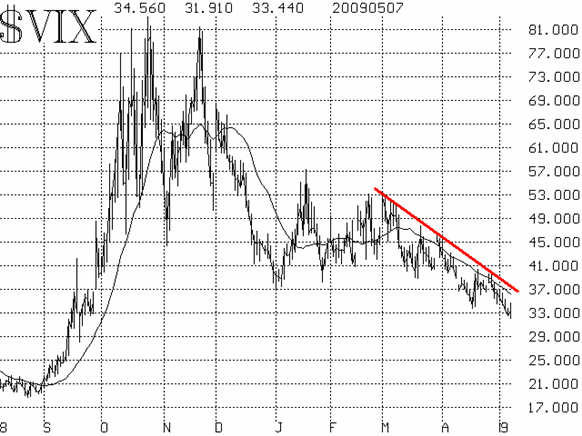
Volatility indices ($VIX and $VXO) remain in downtrends. That, too, is bullish for the broad market. $VIX would have to climb above 37 to jeopardize the current downtrend.

In summary, the situation remains bullish. The overbought nature of breadth and the put-call ratios indicates that sharp, but short- lived corrections are possible. But the intermediate-term trend is still upward.
Lawrence G. McMillan is the author of two best selling books on options, including Options as a Strategic Investment, recognized as essential resources for any serious option trader's library.