The relative weakness displayed by the Nasdaq in Wednesday's session sparked a sell-off in the technology arena yesterday, leading to a 2.4% loss in both the Nasdaq Composite and Nasdaq 100 indices. Stocks began the day slightly higher, but traders immediately sold into strength, sending the major indices sharply lower by mid-day. Thereafter, the broad market drifted lower throughout the afternoon. Not surprisingly, the rest of the main stock market indexes were also affected by the weakness in the Nasdaq, but to a lesser degree. The S&P 500 and Dow Jones Industrial Average declined 1.3% and 1.2% respectively. The small-cap Russell 2000 mirrored the Nasdaq brothers by also shedding 2.4%. The S&P Midcap 400 lost 2.5%. All the major indices closed in the bottom quarter of their intraday ranges.
On Wednesday, the highest volume in more than five months accompanied the lackluster performance of the Nasdaq. Yesterday, however, turnover swelled even more. Total volume in the Nasdaq rose 10%, while volume in the NYSE came in 8% above the previous day's level. As such, both the S&P 500 and Nasdaq Composite registered a bearish "distribution day." Although the previous day's session was technically not a "distribution day" for the Nasdaq, it was indicative of "churning." This occurs when volume picks up substantially, but stocks are little changed. It's usually a direct result of mutual funds, hedge funds, and other institutions stealthily selling into strength. When the Nasdaq flashes two straight days of its highest volume in months, and does so on sideways to downtrending price action, it's certainly a red flag for the current rally.
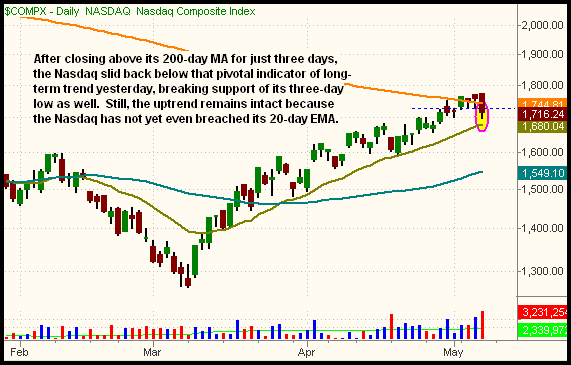
In yesterday's market commentary, we said, "The 200-day moving average of the Nasdaq Composite, which we've discussed several times over the past two weeks, remains a very possible point of contention for the broad market. Though the index has managed to close above that level in each of the past three days, we're not out of the woods yet. . .If the index falls to close below its low of the past three days (below 1,729), it could trigger a wave of sell orders on fears of the 200-day MA. As such, consider keeping tight trailing stops on any Nasdaq-related positions you may be carrying." On the daily chart of the Nasdaq Composite below, notice the index indeed slid below support of its three-day low, closing back below its 200-day MA:

With the 20-day exponential moving average (the beige line) still below the price of the Nasdaq, the current intermediate-term uptrend line off the March 2009 low remains valid. However, the break below the 200-day MA, after closing above its for just three days, is a negative sign, especially when considering yesterday's big volume surge. We'll be watching to see how well the Nasdaq holds up as it approaches and/or touches its 20-day EMA.
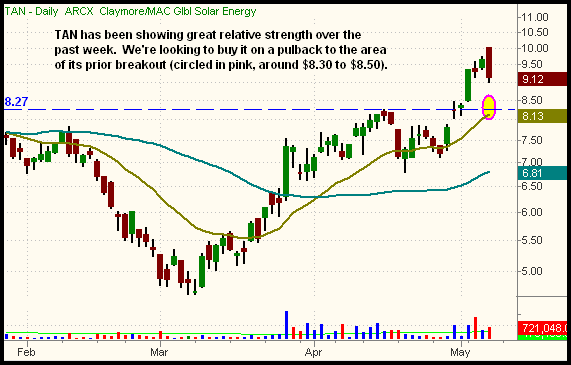
Over the past week, we've pointed out a few ETFs we were waiting to buy on a pullback. If yesterday's performance in the Nasdaq is any indication, we may be entering a short-term correction that will give us those anticipated pullbacks in strong ETFs. Claymore Global Solar Energy (TAN) is one such ETF that may give us an ideal entry point in the coming days. The target buy zone is shown below:

With TAN, the ideal entry point would be a retracement to the vicinity of the April 16 high, around the $8.30 to $8.50 area. With the 20-day exponential moving average rising up, it's likely that moving average will also converge with new support of the prior breakout level, making it more likely TAN will not retrace much steeper.
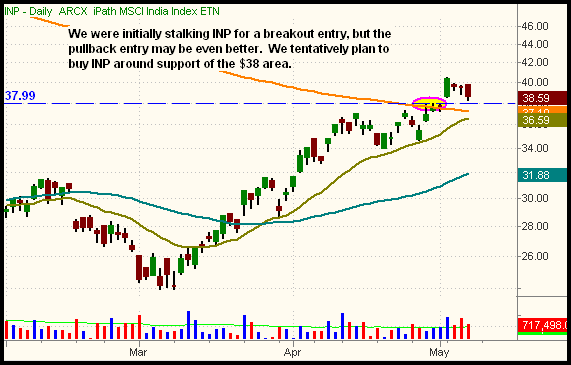
iPath India (INP), which we were pointed out in yesterday's Wagner Daily, traded a few cents above the previous day's high, right after it opened, but did not trigger our buy entry of $39.87. INP subsequently sold off, right alongside of the broad market, but now is setting up for a pullback, rather than breakout, buy entry. Take a look:

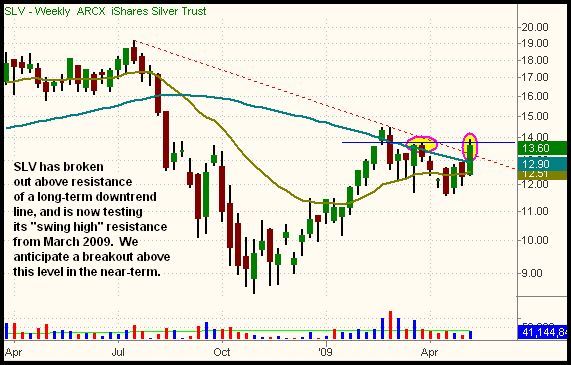
On May 4, we bought iShares Silver Trust (SLV) as it began to break out by moving back above its 50-day moving average. Since then, SLV has had three more consecutive days of gains, and has rallied 7% since this week's buy entry. Now, SLV is testing key resistance of its prior "swing high" from March 2009. It could easily require a few days of consolidation before breaking out to form a new "swing high," but it continues to show great relative strength to both the stock market and its sibling, SPDR Gold Trust (GLD). The longer-term weekly chart of SLV is shown below:

Our position in U.S. Natural Gas Fund (UNG), which we entered on May 6, followed through to break out above its 50-day MA yesterday. Of equal significance was an even greater volume surge than what it has experienced since lifting off its recent lows. Yesterday, total volume in UNG was nearly four times greater than average importantly. The volume spike helped drive UNG to a gain of more than 6% yesterday -- quite nice considering the losses in the broad market.
Open ETF positions:
Long - SLV, UNG, FXY
Short - (none)
Deron Wagner is the Founder and Head Trader of both Morpheus Capital LP, a U.S. hedge fund, and MorpheusTrading.com, a trader education firm.