| Corcoran Technical Trading Patterns For May 11 |
| By Clive Corcoran |
Published
05/10/2009
|
Stocks
|
Unrated
|
|
|
|
Corcoran Technical Trading Patterns For May 11
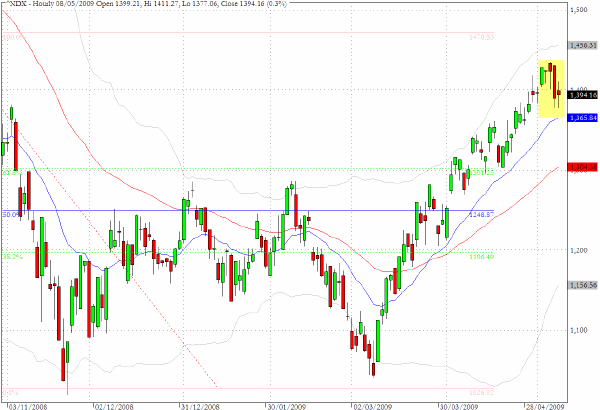
The Nasdaq 100 (NDX), which has been in the vanguard of the persistent upward moves of the overall market, appears to be entering a corrective phase.
Just how much determination the bulls have to rescue matters from a relapse out of the very steep ascent pattern will become clearer this week, but the tone of trading in Asia and Europe suggests that a pullback is quite likely in US trading today.
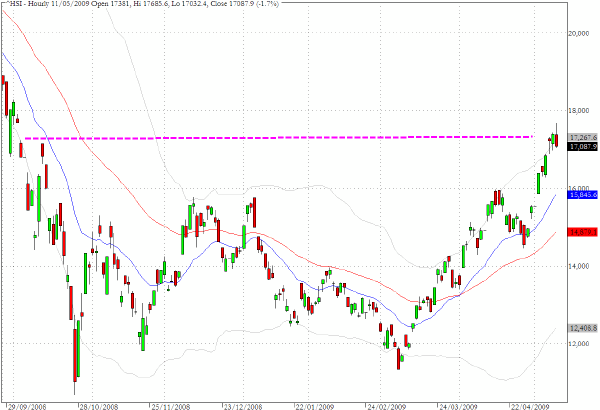
Just by way of clarification all of today’s charts are entitled as Hourly, but this is a software error and they are all in fact Daily charts.
The Hang Seng Index in Hong Kong (HSI) registered a shooting star pattern in Asian trading on Monday.
The S&P 500 (SPX) moved ahead in Friday’s session but there was evidence, in the intraday patterns from Friday, of a lot of resistance in the 925-30 region on the chart.
As indicated the 935-940 area will be a key test for the bulls.
I am not looking to draw any immediately firm conclusion from whether the January 6 levels can be taken out or not. There is a major technical hurdle to overcome and even if it should be breached, one would be looking for at least a second day of confirmation as a "fakeout breakout" scenario would not be too surprising to see.
If the bulls can break above 950 (also the 200-day EMA) and mount a successful charge towards the 1000 level, this could trigger some panic buying by major institutions.
At present, however, the volume and money flow levels are still indicating to me, at least, that there is insufficient conviction behind the remarkable rally to believe that the way is clear for a new bull market to emerge.
To convince me of the latter proposition would take a substantial increase in volume, with much greater participation from several sectors that are still being overlooked as the major quant funds rotate through the economicially sensitive sectors with their ever more complex trading strategies.
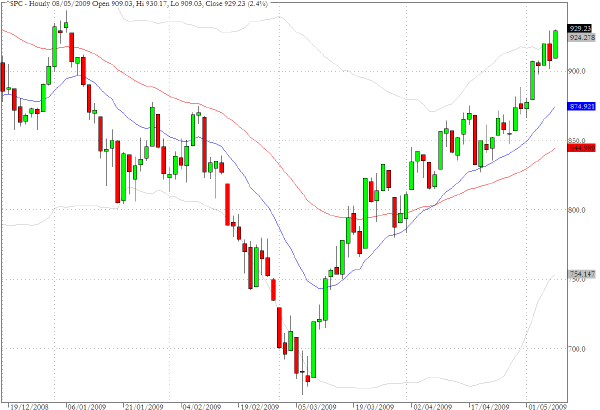
I thought I would revisit a comment made here about one week ago.
As if to add further emphasis to my concerns that we may be approaching an intermediate-term top, there are two sector charts worth considering as well XLY and XLK.
The consumer discretionary stocks, as tracked by XLY, have performed remarkably well since early March and this is one of the few sectors which has broken above its 200-day EMA.
However, the MACD chart is suggesting that the momentum mania is definitely peaking.
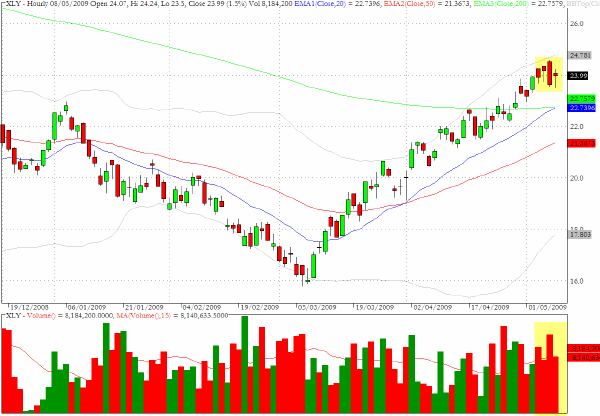
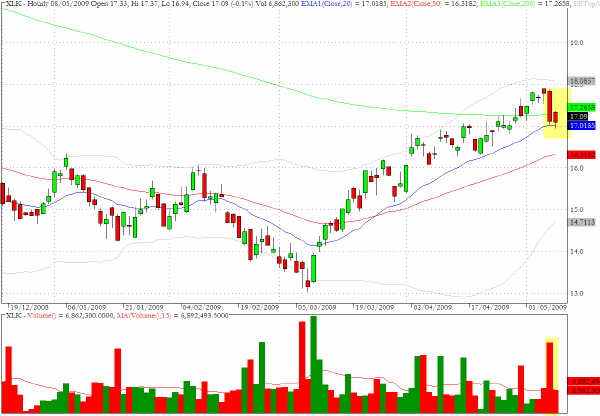
Also discussed in my cautious note regarding XLY from a recent commentary was a similar observation that XLK looked to be entering a topping mode. The sector fund which tracks the technology sector has been faltering for several sessions after penetrating above the 200-day EMA.
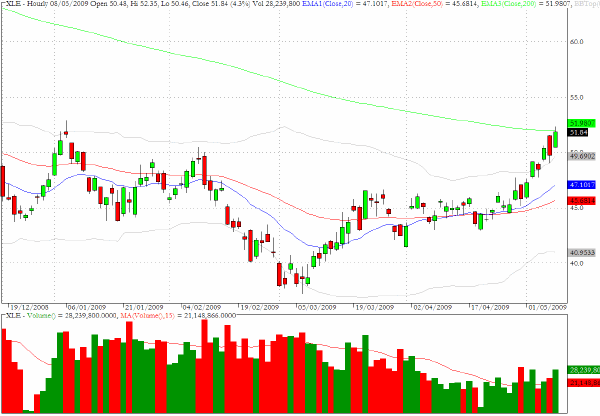
About ten days ago I recommended a long position in XLE, which tracks the energy sector, but would now be looking to exit this trade as I believe that it is part of the sector rotation plays alluded to previously, and that for the same reasons that equities look as though they need to rest, so does this sector.
Clive Corcoran is the publisher of TradeWithForm.com, which provides daily analysis and commentary on the US stock market.
|