|
The Wagner Daily ETF Report For May 12
Stocks launched the week with a session of losses that caused the main stock market indexes to surrender nearly all of the previous day's substantial gains. Equities got off to a lower start on the open, stabilized, but were unable to recover their losses from the gap down. This time, the S&P 500 and Dow Jones Industrial Average played "catch up" to the Nasdaq, which ignored strength in the rest of the major indices by moving lower in the latter half of last week. The S&P fell 2.2%, the Dow declined 1.8%, and the Nasdaq Composite lost 0.5%. The Nasdaq 100 actually eked out a gain of 0.1%, but the index is still down 2% over the past three days. The small-cap Russell 2000 and S&P Midcap 400 indices slid 1.9% and 2.3% respectively. The S&P and Dow finished near their intraday lows. The Nasdaq closed just above the middle of the day's range.
Turnover declined quite a bit, which helped to explain yesterday's intraday vacillation and lack of direction. Total volume in the NYSE receded 17% below the previous day's level, while volume in the Nasdaq ticked 21% lower. In the Nasdaq, total volume dipped below its 50-day average level, but NYSE volume remained at a faster than average pace. Market internals in the NYSE were firmly negative; declining volume exceeded advancing volume by a margin of 5 to 1. The Nasdaq adv/dec volume ratio was basically in equilibrium.
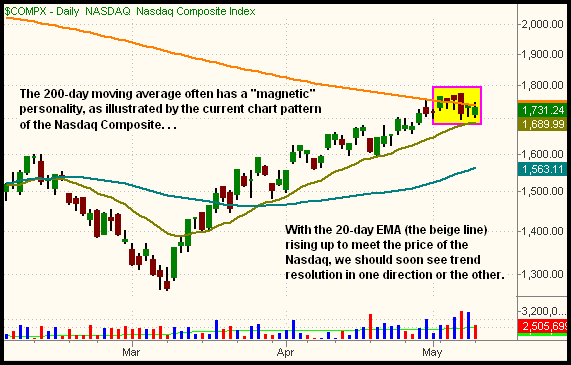
As it often does, the 200-day moving average of the Nasdaq Composite has acted like a magnet over the past week, defining a clear "line in the sand" for the direction of the index. From May 4 through 7, the Nasdaq closed just above its 200-day moving average. But because the initial test of 200-day MA resistance is rarely successful, the Nasdaq slid back to close below its 200-day MA on May 7. In both the sessions that followed, the Nasdaq probed above its 200-day MA on an intraday basis, but was unable to close above it both times. This is shown on the daily chart of the Nasdaq Composite below:

After the Nasdaq first ran into its 200-day MA on April 30, we said the long-term indicator of trend often acts like a "brick wall" the first time the price of a stock, ETF, or index runs into it. Now, less than two weeks later, the chart above has become a great example of why we said that. But what happens now?
At this juncture, the chart is indicating the Nasdaq could resolve its short-term trend in one direction just as easily as the other. One thing for certain, however, is the longer the Nasdaq remains glued to its 200-day MA, the more powerful the eventual upside or downside breakout will be. Volatility contractions eventually lead to high-momentum volatility expansions once trend direction becomes clear. This is because the numerous traders on the other side of the trend are simultaneously forced to close their losing positions and quickly jump into the other side of the market.
In the short-term, we still believe the overall odds favor a significant stock market pullback, possibly led by the Nasdaq, over the possibility of making another leg higher. HOWEVER, a Nasdaq closing price well above the magnetic 200-day MA could cause us to quickly change our assessment, which, by the way, we have absolutely no problem doing. As the Nasdaq corrects by time (consolidates), the 20-day exponential moving average is rapidly rising to meet the price of the range-bound Nasdaq. When it does, the Nasdaq should be forced to make its intentions clear. The current short and intermediate-term uptrends of the broad market will favor an upside breakout above the 200-day MA, but the problem is the stock market remains firmly stuck in a long-term downtrend. If traders and investors were looking for an excuse to exit positions into strength of the long-term bear market, the 200-day MA would certainly give a good technical reason to do so.
Until the Nasdaq shows its hand at this critical level of support/resistance, it's a good idea to steer clear of the broad-based ETFs (SPY, DIA, QQQQ, etc.). Instead, consider ETFs in sectors with a low correlation to stock market direction (currency, commodity, and bond ETFs fit the bill). Because they are not tied to the trend of the main stock market indexes, we are quite comfortable with our three open positions: U.S. Natural Gas Fund (UNG), iShares Silver (SLV), and CurrencyShares Japanese Yen (FXY). Since entry, UNG is presently showing an unrealized gain of 12% and SLV is 8% higher. FXY is still near our original entry point, but broke out yesterday, and is now back above its 20, 50, and 200-day moving averages. We continue to build our watchlist of additional ETFs to consider buying on pullbacks to their 20 and/or 50-day moving averages. That watchlist currently includes, among others, the following tickers: EEM, TAN, FAN, and KOL.
Open ETF positions:
Long - UNG, SLV, FXY
Short - (none)
Deron Wagner is the Founder and Head Trader of both Morpheus Capital LP, a U.S. hedge fund, and MorpheusTrading.com, a trader education firm.
|