| Corcoran Technical Trading Patterns For May 13 |
| By Clive Corcoran |
Published
05/13/2009
|
Stocks
|
Unrated
|
|
|
|
Corcoran Technical Trading Patterns For May 13
The bulls are remaining tenacious and in yesterday’s session there were clearly spirited attempts to protect key levels on the S&P 500.
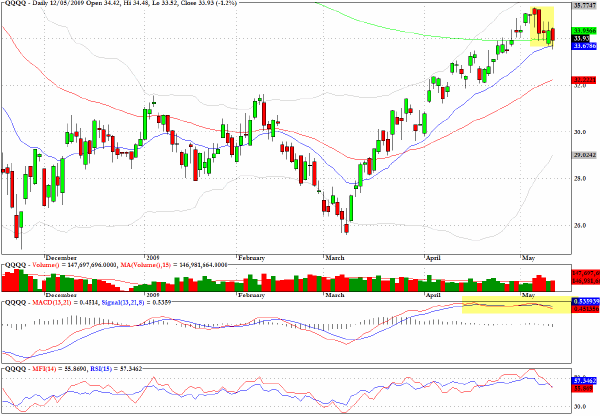
The daily chart for QQQQ, the exchange traded proxy for the Nasdaq 100, is revealing waning momentum and the increased volume on the recent pullback is suggesting that this index, having out-performed the rest of the market for several weeks, is now looking the most problematic in the near term.
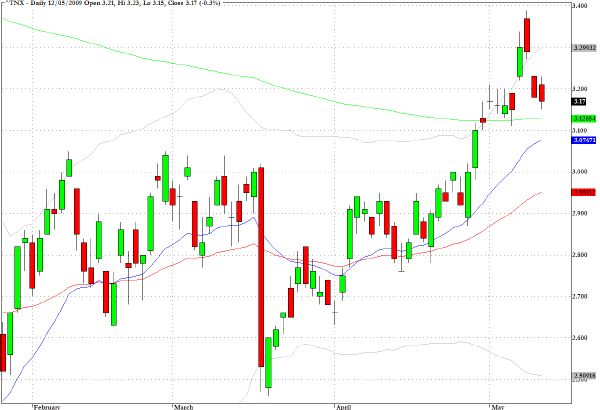
Yields on the ten-year Treasury note (TNX) are appearing to benefit from an uptick in risk aversion but the yields may find it difficult to break back below the 200-day EMA.
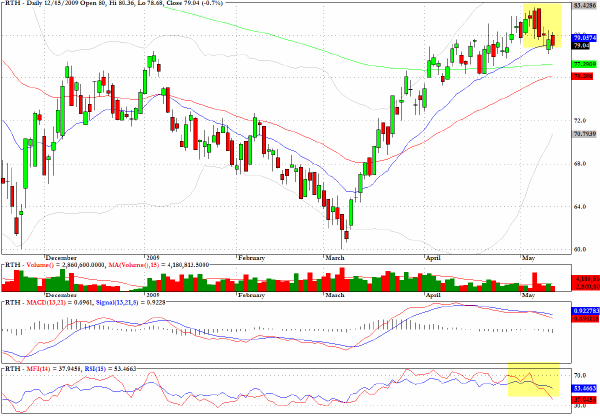
The retailing sector fund, RTH, has pulled back but the configuration of the moving averages suggests that while the 200-day EMA may be an obstacle that has restrained progress, the 50-day EMA which is not far below could be expected to provide considerable support.
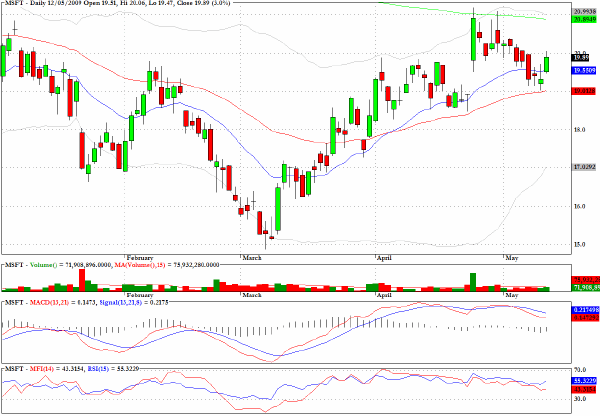
The comment last week that Microsoft (MSFT) was showing evidence of a bullish flag pattern with entry opportunities close to moving average support could have provided a timely opportunity yesterday for a 3% gain on the long side.
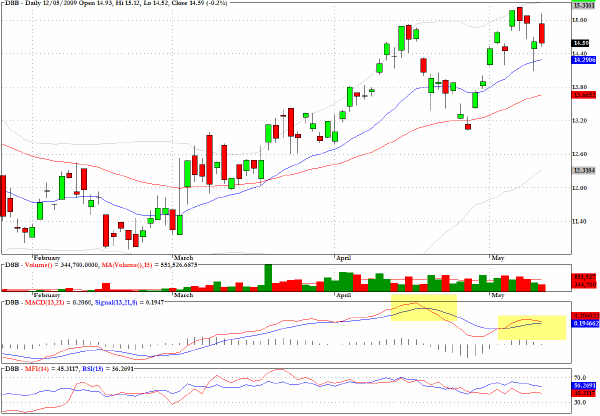
The exchange traded fund for base metals is revealing a classic MACD negative divergence pattern.
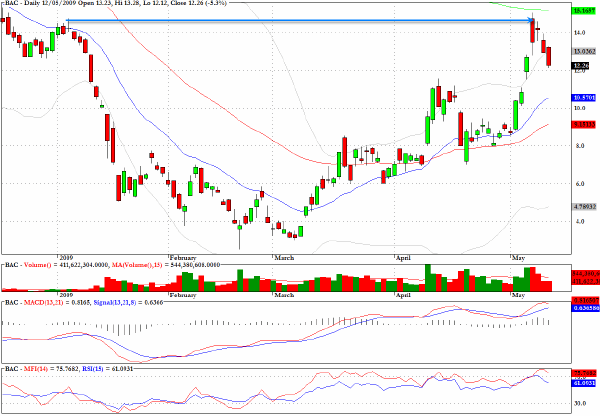
The chart for Bank of America (BAC) faces, in accordance with an enormous number of charts, resistance from the January high and the 200-day EMA.
Clive Corcoran is the publisher of TradeWithForm.com, which provides daily analysis and commentary on the US stock market.
|