|
The Wagner Daily ETF Report For May 14
After more than a week of chopping around near its 200-day moving average, the Nasdaq finally decided way it wanted to go. Not surprisingly, the rest of the main stock market indexes fell alongside of it. Despite an upside reversal attempt the previous afternoon, stocks gapped down to open yesterday's session near Tuesday's lows. Trapping the bulls and enticing the bears who detected the Nasdaq's key break of support, stocks subsequently trended lower throughout the rest of the session. The Nasdaq Composite tumbled 3.0%, the S&P 500 2.7%, and the Dow Jones Industrial Average 2.2%. Small and mid-cap stocks took it on the chin, as the Russell 2000 and S&P Midcap 400 indices plunged 4.7% and 4.4% respectively. All the major indices finished at their intraday lows.
Total volume in the NYSE increased 10% above the previous day's level, causing the S&P 500 to register a bearish "distribution day." Turnover in the Nasdaq, however, eased 6%. Despite the 3% loss in the Nasdaq, it's positive the decline occurred on lighter volume. This indicates institutions were not making a mad dash to the exit doors. Nevertheless, market internals in both exchanges were pretty ugly. In the NYSE, declining volume exceeded advancing volume by more than 10 to 1. The Nasdaq adv/dec volume ratio was negative by a nasty 20 to 1 ratio.
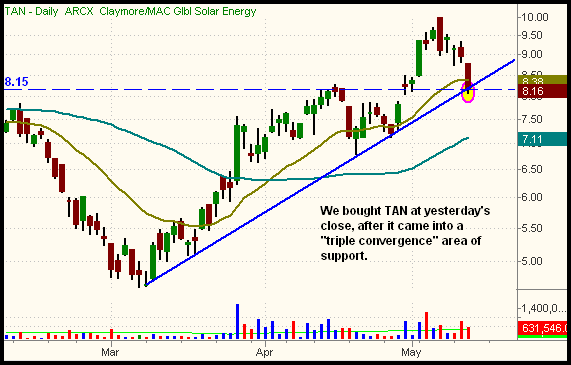
In yesterday's Wagner Daily, we took an updated look at a handful of ETFs we've been stalking for pullback entries. Now that the stock market finally appears to be entering at least a short-term correction, we should soon be provided with the low-risk entry points we've been patiently waiting for. One of those ETFs, Claymore Global Solar Energy (TAN), pulled back to a key area of support that afforded an ideal buy entry, one which we took advantage of. The daily chart of TAN is shown below:

On the chart above, notice there are three major levels of support that have roughly converged in the same area: the 20-day exponential moving average (the beige line), horizontal price support from the prior breakout level (the dashed blue line), and the intermediate-term uptrend line from the March 2009 low (the solid blue line). With technical analysis, the more indicators that converge to act as support or resistance, the more likely that support or resistance will remain intact. Although the 20-day EMA was technically breached, TAN closed only twenty cents below the exact price of the 20-day EMA. A little probe or "shakeout" below obvious levels of support is common, and generally does not constitute a break of support unless the violation below the support level is greater than approximately 3%. Because of the triple convergence of support TAN has come into, we bought it just before yesterday's close, exactly at its current price. Our initial protective stop is below the "swing low" support of April 21 (at $6.53).
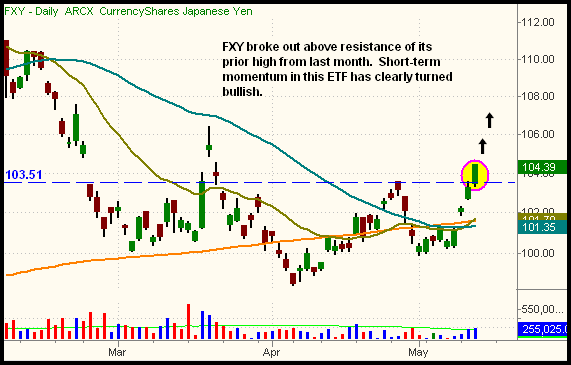
Our Silver (SLV) and Natural Gas (UNG) positions pulled back yesterday, but CurrencyShares Japanese Yen (FXY) rallied 1.1%. More importantly, it broke out above resistance of its prior "swing high" from April 28, and volume has picked up in each of the past four upward sessions. Now that FXY has moved above its prior high, convergence of the 20, 50, and 200-day moving averages, at the $101.50 area, should now provide solid support on a pullback. Yesterday's breakout in FXY is shown below:

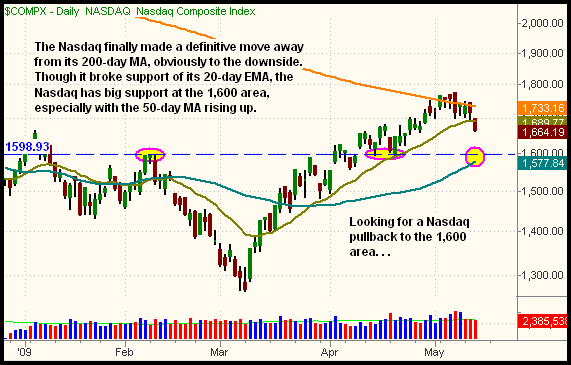
Definitively slicing through the lows of the past week's consolidation, the Nasdaq Composite is now "officially" in pullback mode, after running into pivotal resistance of its 200-day moving average. The index has also closed below support of its 20-day EMA for the first time since the two-month uptrend began. This is shown on the daily chart of the Nasdaq below:

While yesterday's sell-off changes the Nasdaq's short-term trend to "down," the intermediate-term uptrend remains fully intact. In actuality, as we've mentioned numerous times in recent weeks, a substantial pullback would indeed be quite healthy for the market, as overheated markets tend to fall too quickly. As for a downward projection, one could expect the Nasdaq to head down to the 1,600 level, which is support of the prior highs from February. If it does that within the next week, the 50-day moving average will have risen up to that area, which converges with a significant level of horizontal price support (the dashed blue horizontal line). Holding up better than the Nasdaq, the S&P 500 and Dow Jones Industrial Average both closed right at support of their 20-day EMAs, but any further weakness in the Nasdaq will likely pull those indexes lower as well.
With the market now in short-term correction mode, our job is to stay on top of ETFs that showed the most relative strength during the uptrend, then determine proper entry points to buy them on pullbacks to support. In doing so, it's important to realize those pullbacks may not be in sync with the patterns of the main stock market indexes. Just as the best-performing ETFs moved to new highs ahead of the major indices, they can also retrace to key support levels before the broad market does. Keeping an eye on the patterns of the Nasdaq, S&P, and Dow helps give one overall perspective, but don't make the mistake of basing all your ETF trading decisions solely on the patterns of those indexes (unless, of course, you're trading a broad-based ETF like S&P 500 SPDR [SPY]). Case in point is our new entry into TAN. We realize the Nasdaq could pull back further, but TAN is now at a technically proper point of buy entry. If it maintains the relative strength it has recently been showing, one could easily expect TAN to hold firm, near its current price, even if the broad market moves lower. Then, when stocks subsequently find support, TAN should be among the top performers on the way back up.
We now have a diverse mix of open positions. Our position in UltraShort QQQQ ProShares (QID), which we bought two days ago, allows to take advantage of the short-term bearishness in the Nasdaq. But just in case the weakness turns out to be very short-lived, our new long entry into TAN provides for the ability to realize profits on the way back up. Our other three positions, SLV, UNG, and FXY all have a low correlation to the direction of the broad market, and have generally been trending higher on both winning and losing days in the broad market. Overall, we feel it's a diverse, low-risk mix of positions to hold at a transitional market inflection point. So far, performance in these ETFs has been confirming this notion.
Open ETF positions:
Long - QID, FXY, SLV, TAN, UNG
Short - (none, but QID is an inversely correlated ETF)
Deron Wagner is the Founder and Head Trader of both Morpheus Capital LP, a U.S. hedge fund, and MorpheusTrading.com, a trader education firm.
|