| The McMillan Options Strategist Weekly |
| By Lawrence G. McMillan |
Published
05/15/2009
|
Options
|
Unrated
|
|
|
|
The McMillan Options Strategist Weekly
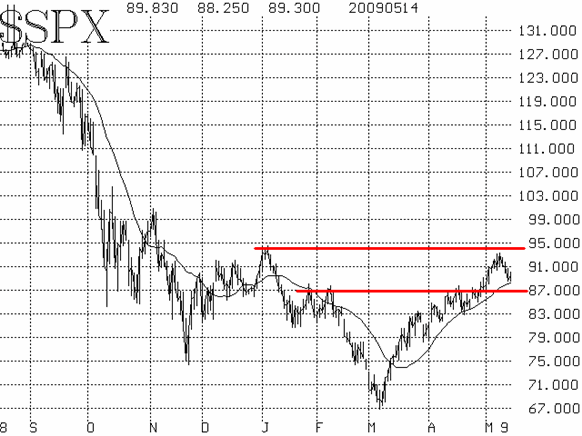
The rally that began in early March has now carried $SPX back to nearly where it started this year -- at 940. In short, $SPX has made a 270-point round trip down and up in the first four and a half months of this year. Now, that's some volatility! Those January highs represent resistance for the index now, as do the October highs at 1000 on $SPX.

In the short term, the chart of $SPX is bullish (Figure 1). The series of higher highs and higher lows is intact, and the 20-day moving average is rising. The resistance at 930-940 is visible on this chart as well. There is support at 870-875, from where the market topped out in late January, early February, and -- temporarily -- mid-April. If that level were violated on the downside, it would turn the $SPX chart negative. Conversely, as long as $SPX stays above that level, the bullish case is still dominant.

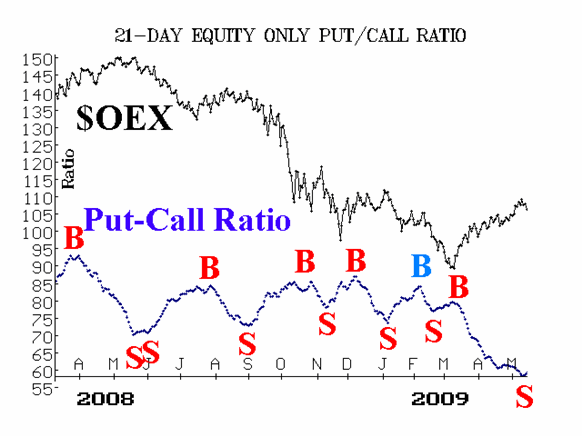
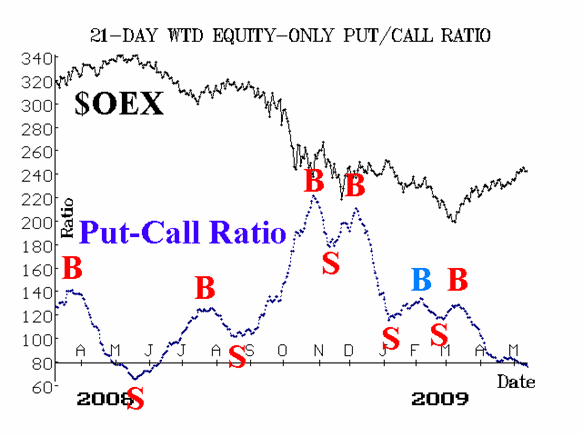
Equity-only put-call ratios have taken on a more negative picture as well. The standard ratio has generated a sell signal that is confirmed by the software that we use for analyzing these charts. The weighted ratio, has not yet confirmed a sell signal.

Market breadth indicators have finally retreated from their near- historic overbought condition, and they too have generated sell signals.

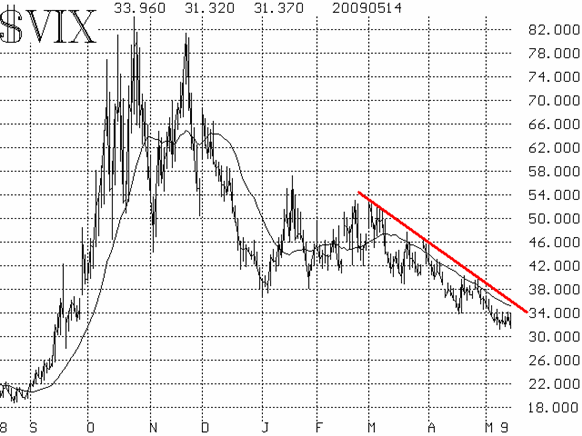
Volatility indices ($VIX and $VXO) continue to decline, and that is bullish. $VIX is in a clear downtrend, and has been for some time. Its path mirrors that of the actual 20-day historical volatility of $SPX, which is now under 30. $VIX will maintain a bullish posture unless it closes above its declining moving average -- currently at about the 36 level.
In summary, $SPX is likely trapped in a trading range between 870 and 940.
Lawrence G. McMillan is the author of two best selling books on options, including Options as a Strategic Investment, recognized as essential resources for any serious option trader's library.
|