| Corcoran Technical Trading Patterns For May 18 |
| By Clive Corcoran |
Published
05/17/2009
|
Stocks
|
Unrated
|
|
|
|
Corcoran Technical Trading Patterns For May 18
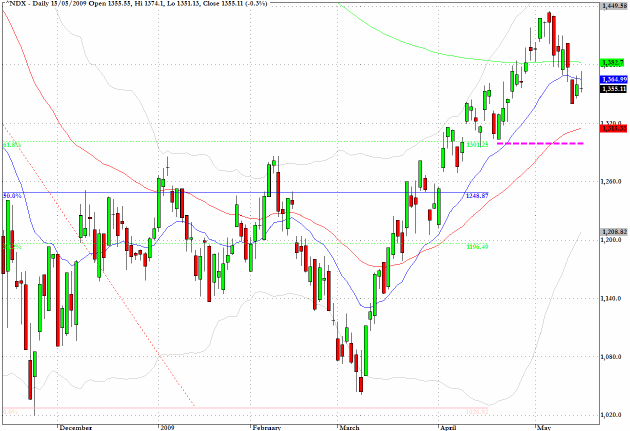
The Nasdaq 100 (NDX) looks likely to retest the area around 1300 which is just below the 50-day EMA and also coincides with the 62% retracement level within the fibonacci framework which I have been using for the last few months.
Readers may be interested in the following brief article which I posted to the Seeking Alpha site this weekend in response to the suggestion that US Treasury officials are not showing great skill in negotiating commercial arrangements with TALF participants.
The comment was made by a critic of a recent deal between the Treasury and Old National Bancorp that
U.S. Treasury officials’ incentives are not as well aligned with the interests of taxpayers as bank managers’ incentives are aligned with the interests of their shareholders.
I responded as follows:
The general point to be made in this regard, and it goes to the heart of the fallibility of having the public sector so immersed in dealing with the financial crisis, is that this type of misalignment of interests is a variation on the Tragedy of the Commons issue.
Treasury officials should be negotiating to get better deals for the U.S. taxpayer and are ultimately accountable to everyone (apart from those who use Swiss bank accounts). However the paradox or tragic irony is, and this is yet another example of the Looking Glass world we are entering, when something (including accountability) belongs to everyone, it essentially belongs to no one.
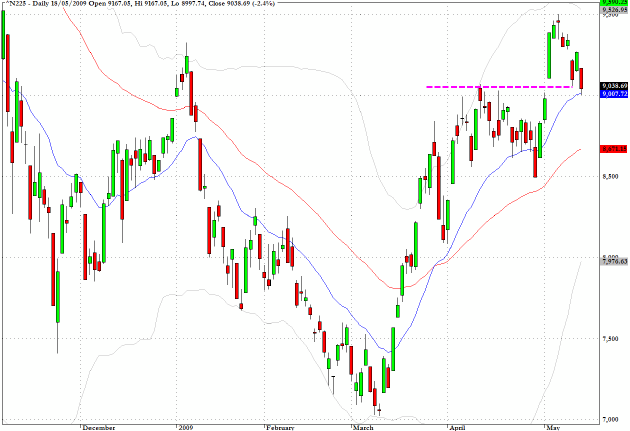
The Nikkei 225 in Monday’s session more than reversed the gain made last Friday and now sits just above the fairly critical 9000 level - having dropped below that level during the session.
A failure over the next few sessions to retest the recent intraday high around 9500 - marked by the hanging man/doji candlestick - would strongly suggest that an intermediate top is in place.
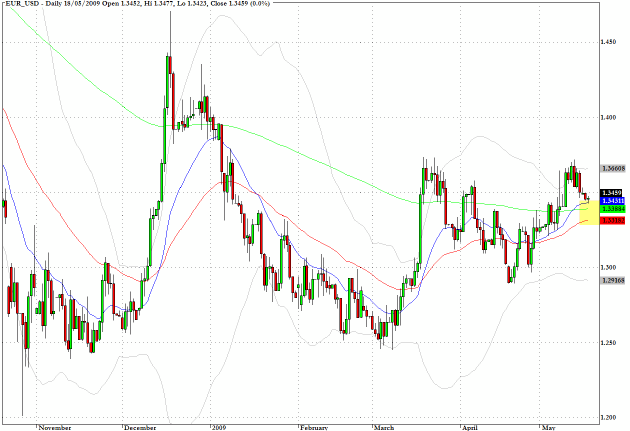
One of the most useful charts to monitor in coming sessions, in my opinion, will be for the Euro/US Dollar cross rate. The currency has been moving rather cautiously recently and seems to be attracted to the $1.35 level which also represents the 50% fibonacci level from the swing high and low seen on the chart.
There are ominous rumblings within some of the Eurozone economies about the depth of the downturn and whether or not the EU as a financial mechanism has the wherewithal to provide the necessary safety net should any one of the marginal economies fall off the edge.
On this topic, the Hayman Advisors hedge fund which successfully called the sub prime debacle, is predicting that several European states could default. I would find that shocking but not totally surprising.
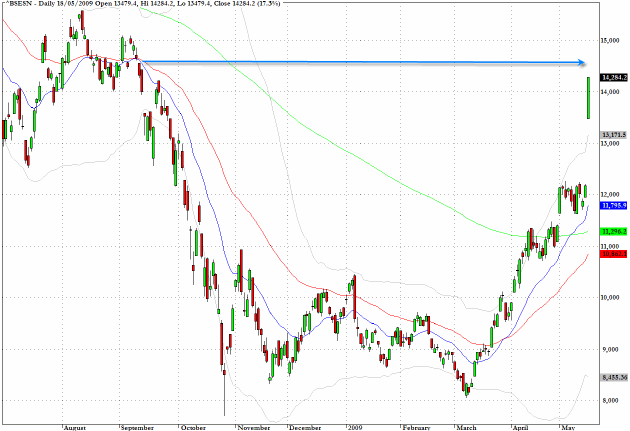
There was much to celebrate in Mumbai today as the recent Indian elections have produced a decisive majority for the Congress Party. Traders could barely contain their enthusiasm for the result and the market rocketed by 17% before trading had to be suspended for the session.
The world’s largest democracy is also one of the more dynamic of the BRIC countries and is on my buy list, but there should be resistance at the level indicated which shows an area of previous price congestion.
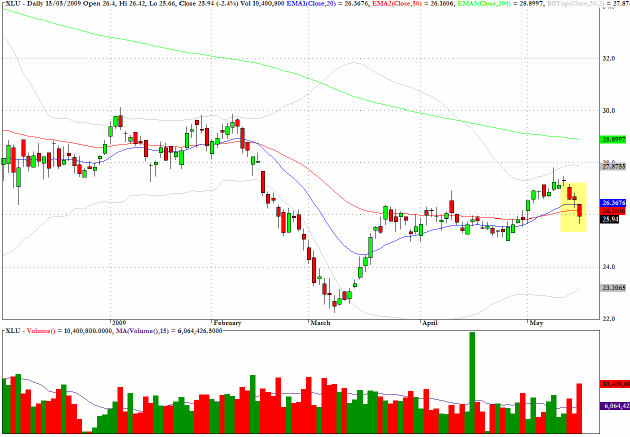
XLU, an exchange traded fund which tracks the utilities sector, has broken below key support levels and violated the uptrend line from the March low.
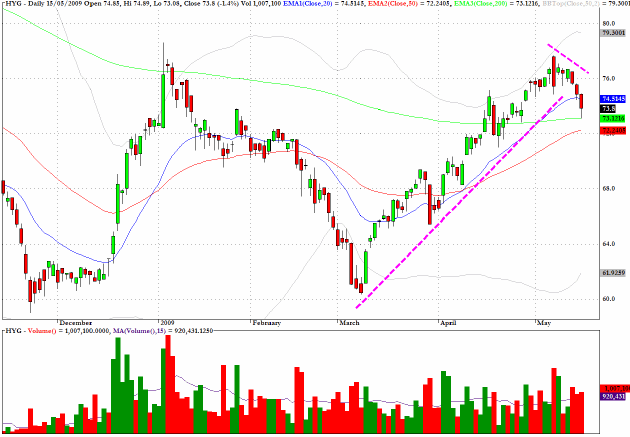
HYG, one of the ETF’s which tracks the high yield corporate bond market, after correcting as anticipated here a couple of weeks back, is approaching an area where some buying support should be expected.
A failure to find such support would be another factor indicating that equities may be looking at an intermediate term correction.
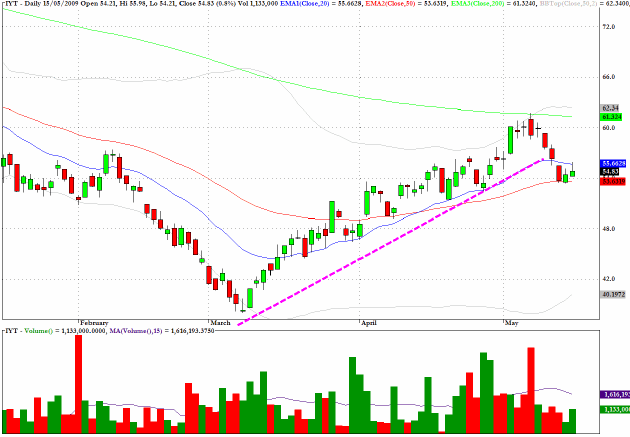
IYT, which is an ETF which tracks The Dow Jones Transport Index, has also broken below the uptrend line from the March low and now faces a test of the 50-day EMA.
Clive Corcoran is the publisher of TradeWithForm.com, which provides daily analysis and commentary on the US stock market.
|