|
The Wagner Daily ETF Report For May 18
After opening near the flat line, stocks attempted to rally last Friday morning, but reversed into negative territory by mid-day. The major indices drifted in a sideways range throughout the afternoon, finishing the day with moderate losses. The Nasdaq Composite declined 0.5%, the Dow Jones Industrial Average 0.8%, and the S&P 500 1.1%. The small-cap Russell 2000 and S&P Midcap 400 indices fell 1.0% and 1.1% respectively. The main stock market indexes settled near the bottom quarter of their intraday ranges.
Despite last Friday being monthly options expiration day, turnover eased across the board. Total volume in the NYSE declined 3%, while volume in the Nasdaq was 4% lighter than the previous day's level. The slower pace of trading enabled the S&P and Nasdaq to dodge the label of a bearish "distribution day." Considering that monthly options expiration typically results in higher volume, but didn't this time, it was an especially slow, non-committal session. Declining volume in the NYSE exceeded advancing volume by a margin of 4 to 1. The Nasdaq adv/dec volume ratio was only marginally negative, by a ratio of less than 3 to 2.
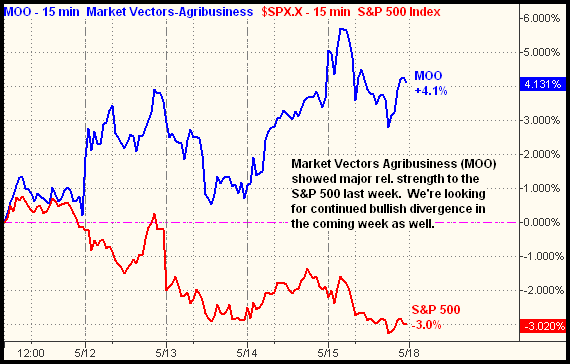
Since the market finally pulled back last week, we spent a lot of time over the weekend scanning for ETFs that showed relative strength by trending higher as stocks retraced from their recent highs. As detailed in my book, Trading ETFs: Gaining An Edge With Technical Analysis, ETFs that don't go down when the major indices do are often the first ones to rocket higher when the broad market eventually heads back up. Likewise, if the broad market continues lower, ETFs with relative strength are usually the last ones to fall, and fall at a lesser percentage than the major indices. Based on our extensive scanning, one of the strongest ETFs we're now stalking for potential buy entry is Market Vectors Agribusiness (MOO). As a clear visual reference, check out the following "percentage-change chart" that compares last week's performance of the S&P 500 to MOO:

On Monday, May 11, the S&P 500 and MOO roughly traded in sync with one another. But on May 12, MOO suddenly began showing major relative strength to the S&P 500. That day, the S&P 500 edged 0.1% lower, while MOO zoomed 3.0% higher. Wanting to make sure the bullish divergence was not just a one-day fluke, we continued monitoring its performance throughout the rest of the week. By Friday, MOO had gained 4.1% on the week, as the S&P 500 actually lost 3.0%. This tells us we're seeing legitimate buying interest and rotation into the sector.
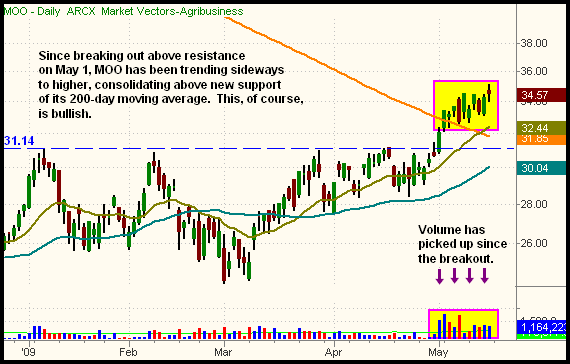
Buying ETFs with relative strength to the broad market is certainly a key element of our strategy, but it's equally important to make sure the patterns on the daily charts confirm the bullishness. As such, let's take a look at the daily chart of MOO:

On May 1, MOO broke out above a major level of horizontal price resistance, as marked by the dashed, horizontal line. Bullish momentum of the breakout immediately carried MOO through its 200-day moving average (the orange line) the following day. Since then, it's been drifting sideways to higher in a base of consolidation, above the 200-day MA. Moreover, it has done so while the main stock market indexes have moved sideways to lower.
Between the relative strength shown on the first chart, and the bullish pattern on the daily chart, we like the setup enough to target MOO for potential buy entry in the coming week. We plan to do so either on a breakout above its recent consolidation (just above last Friday's closing price), or on a pullback to support of its 20-day exponential moving average (the beige line). The 200-day MA should now provide support, right at the bottom of the recent band of consolidation. If we buy MOO, our initial protective stop will be just below the May 1 breakout level (plus some "wiggle room").
As for the broad market, last Friday's action was rather inconsequential, especially considering it was options expiration day. The Nasdaq Composite remains below its 200-day moving average, but not by a wide enough margin that one strong day of gains couldn't push it back above. The S&P 500 and Dow Jones Industrial Average are sitting right on support of their 20-day exponential moving averages, which they have been glued to for the past three days. Volume patterns have generally not been very bearish, and recent performance in leading stocks has not been that negative either. Nevertheless, the Nasdaq has technically entered into pullback mode, and a substantial retracement from this month's highs would not be surprising, especially given the market's huge gains over the past two months. This all adds up to a potentially transitional market that is best managed through focusing primarily on ETFs with a low correlation to the major indices, along with the possibility of an inversely correlated ETF or two thrown in the mix. We're quite comfortable with our existing model portfolio of positions, each of which is presently showing an unrealized gain.
Open ETF positions:
Long - SLV, FXY, UNG, QID, TAN
Short - (none, but QID is an inversely correlated ETF)
Deron Wagner is the Founder and Head Trader of both Morpheus Capital LP, a U.S. hedge fund, and MorpheusTrading.com, a trader education firm.
|