| Corcoran Technical Trading Patterns For May 20 |
| By Clive Corcoran |
Published
05/19/2009
|
Stocks
|
Unrated
|
|
|
|
Corcoran Technical Trading Patterns For May 20
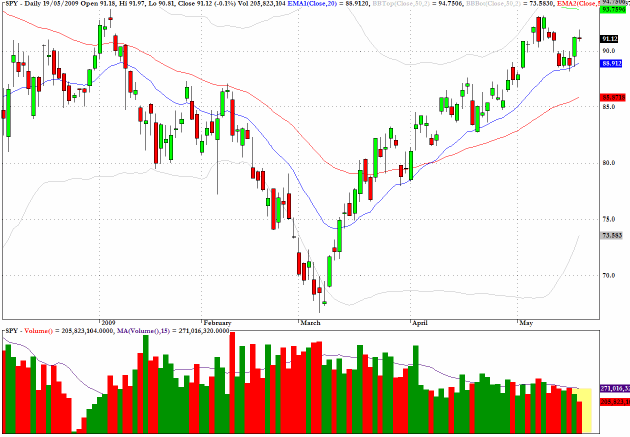
Yesterday was an erratic session although most indices did not cover wide ranges. The S&P 500 proxy SPY in fact has registered a doji star formation after just failing to push above the $92 level.
Volume was below average and less than Monday’s as the markets drift into the Memorial Day weekend.
As suggested yesterday, there is a sense that the market seems to be stalling just below the 200-day EMA and, if it had not been for adverse news on new housing starts, there could have been a rally up towards $93 at which point I am expecting sellers to really test the resolve of the bulls.
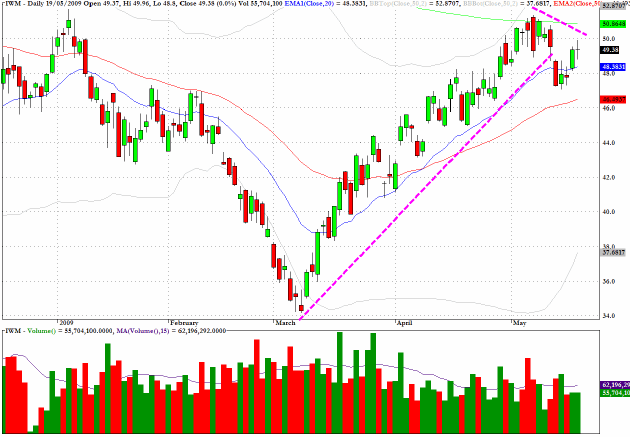
IWM, the exchange trade vehicle which tracks the Russell 2000, registered another doji star and confronts equal challenges to SPY although the technical condition reveals a slightly more precarious position for the small cap stocks at this stage.
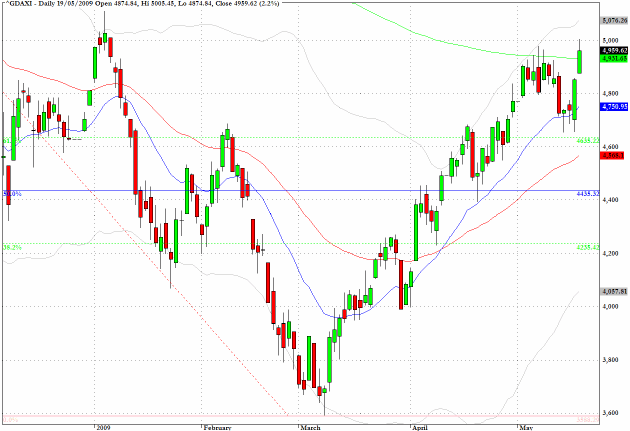
The DAX in Germany managed to peek above the 5000 level intraday yesterday and has recently been revealing relative strength among the major European indices. The January 6 intraday high is found just over 100 points above yesterday’s high and a failure to rally back to this level in the face of the 200-day EMA would be a negative technical development.
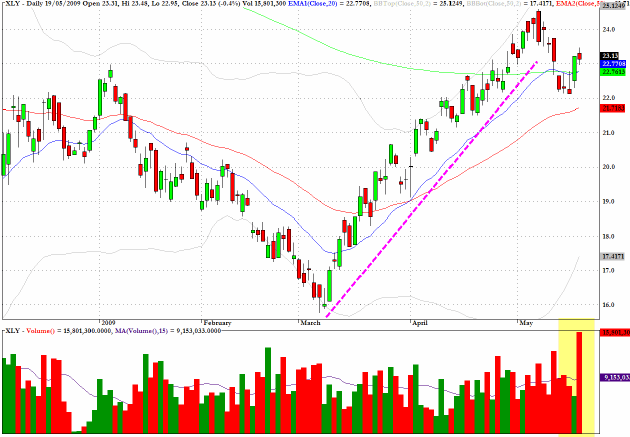
Substantial volume was registered yesterday for the consumer discretionary stocks, as tracked by XLY, and the sector may struggle to move back towards the 25 level.
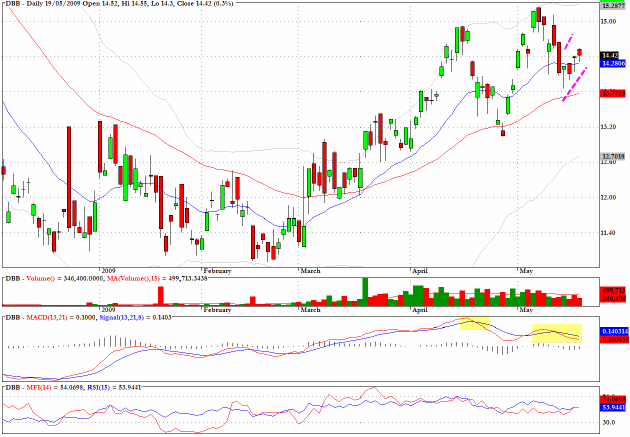
DBB, which is an exchange traded fund tracking the price of base metals, is revealing MACD negative divergence as well as an evolving bearish flag formation.
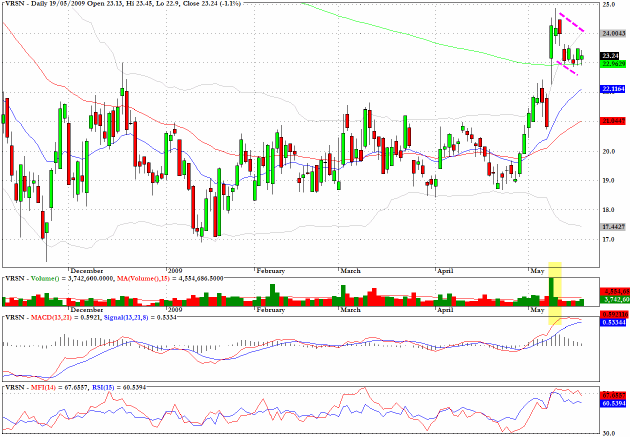
Verisign (VRSN) has the required characteristics for a bull flag pattern.
Clive Corcoran is the publisher of TradeWithForm.com, which provides daily analysis and commentary on the US stock market.
|