| Corcoran Technical Trading Patterns For May 21 |
| By Clive Corcoran |
Published
05/20/2009
|
Stocks
|
Unrated
|
|
|
|
Corcoran Technical Trading Patterns For May 21
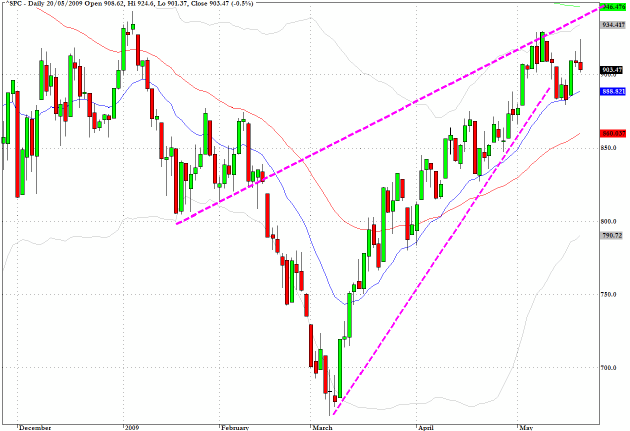
Action in the S&P 500 (SPX) yesterday along with other reflation trading strategies (see discussion below) suggests that an inflection point has been reached with a presumption that an intermediate-term top is in place.
The news overnight will almost certainly weigh on US markets today as well. Asian economies continue to show signs of major weakness, European stocks are moving into a corrective mode and S&P has announced a negative outlook on the state of the UK’s finances which is clobbering sterling.
As revealed here before, the rising wedge patterns on many charts and the coincidence with the mid-May time from 2008 seem rather uncanny.
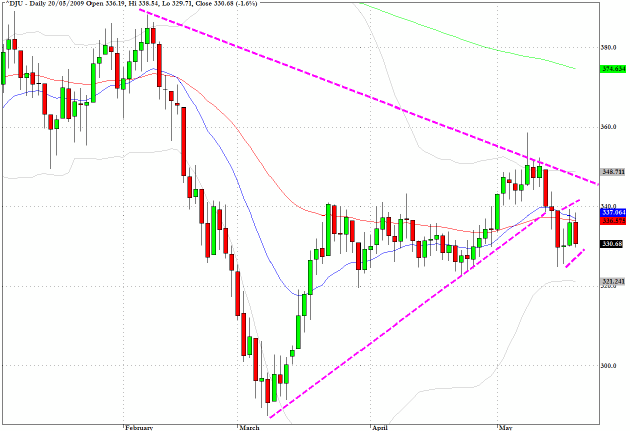
The chart for the Dow Jones Utilities (DJU) reveals a nasty looking potential breakdown pattern with a bear flag evolving following a break from the triangle.
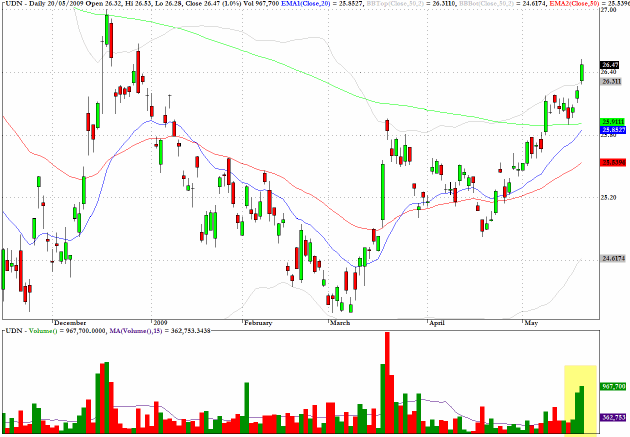
The chart for UDN, which is an inverse tracker for the US dollar as benchmarked against several major currencies, shows the damage done yesterday to the greenback. On this I posted an article this morning at my blog site and which has also been republished at SeekingAlpha.
US dollar weakness is part of a reflation trade strategy designed to snooker the advance in equities.
Yesterday in particular saw big moves in commodities, commodity-based currencies, sterling, gold, emerging market, etc. which ultimately caused a reversal in US equity indices.
The prevailing dynamics for currencies – which are now firmly in place – are that the USD will weaken as risk appetite returns and as all the public sector-induced liquidity is channeled into emerging markets and commodities.
On the other hand, the US dollar will strengthen when risk aversion returns – likely to be triggered by another wave of “difficulties” which will damage sentiment for global equities. However, that would not be good for paying off all the national debt which would itself not be good for faith in the US currency.
Either way the outlook for the US dollar is what could be likened to a “double-bind” - not pretty.
Sterling surged in trading yesterday, but in trading on Thursday morning in Europe it is now plunging following a negative outlook from S&P on the UK’s public finances.
Just when it seemed as though things could not get any worse for Prime Minister Brown - with ongoing revelations about MP’s gorging on taxpayer funded expense allowances - they have.
Things could get quite ugly for Brown (and others who live on the Sceptered Isle) as we are now staring at a constitutional crisis and perhaps a crisis in selling gilts. Oh dear!
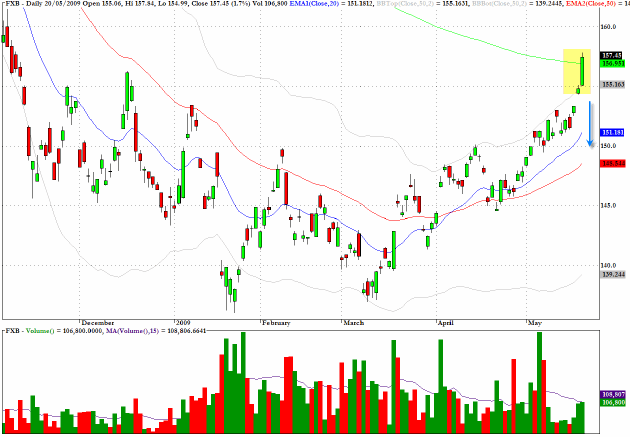
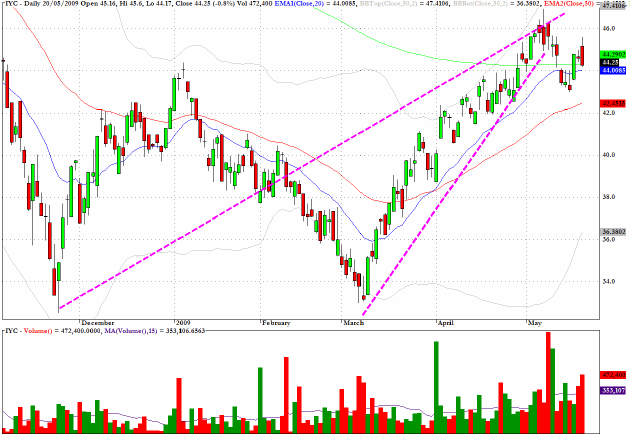
The chart for IYC, an exchange traded fund which track the Dow Jones US Consumer services sector, is revealing a very similar formation to that seen on the chart above for the S&P 500.
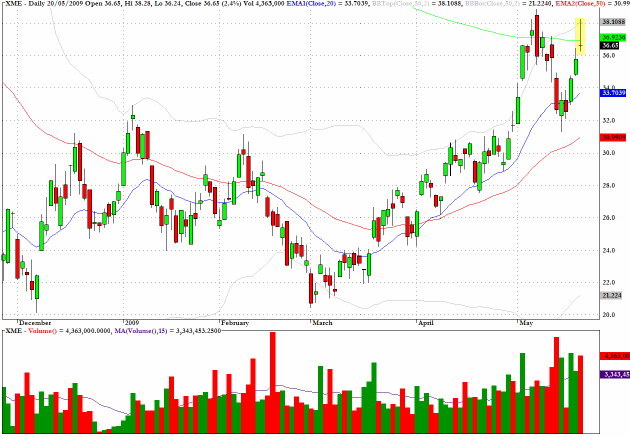
XME registered a text book case of a doji star formation which takes on added significance as it also straddles the 200-day EMA.
This is another indication that markets are at an inflection point.
Yesterday saw increasing validation for the hypothesis launched here last week.
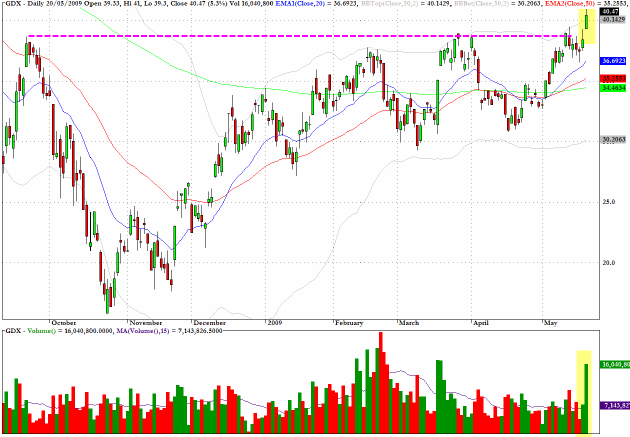
GDX, which provides exposure to the gold mining stocks via an exchange traded fund, has approached a potential breakout level. There are also a series of nested cup and handle formations which are bullish.
My only concern is that the volume charts are not revealing an anticipation of a breakout so I would wait for some evidence of highly motivated buyers to emerge.
If the price action does bring in a lot of buyers it could turn into a rather upbeat scenario for gold miners and the precious metal itself.
If my view that yesterday was a key inflection point in the reflation versus equities tussle is correct, then it might be worth watching from the sidelines just a little longer on gold. The anti-Armageddon trading desks will probably want to test the conviction of the yellow metal punters with another nasty sell-off - whether they will get their chance is not obvious.
Either way, if the metal is going to break above $1000, which I believe is increasingly probable in coming weeks (days?), there will be plenty of scope for an exciting ride up with the mining stocks as well.
Clive Corcoran is the publisher of TradeWithForm.com, which provides daily analysis and commentary on the US stock market.
|