| Corcoran Technical Trading Patterns For May 26 |
| By Clive Corcoran |
Published
05/26/2009
|
Stocks
|
Unrated
|
|
|
|
Corcoran Technical Trading Patterns For May 26
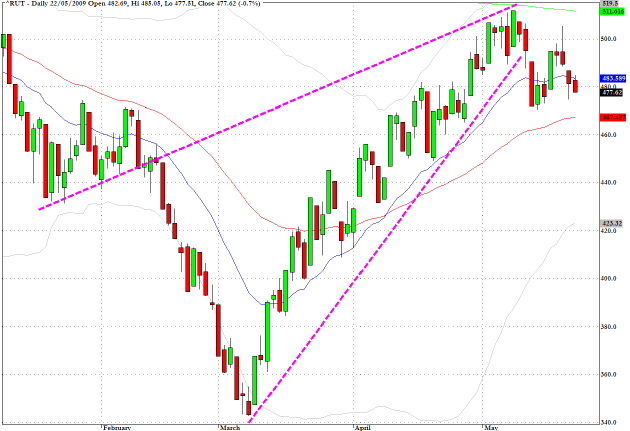
The Russell 2000 (RUT) eased by another 0.7% in Friday’s trading and the formation on this small cap index is pointing to the clearest evidence, among the broader equity indices, that the rising wedge patterns are slowly coming apart.
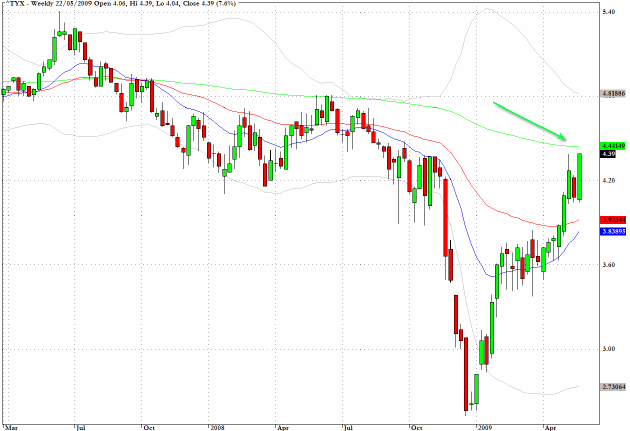
Yields on long-term Treasuries have moved significantly higher over the last few sessions as the enormity of the deficits and amount of public borrowing required by the US government is beginning to rattle some of the cheerleaders who are methodically pushing the "green shoots" narrative.
The weekly chart below shows how sharp has been the ascent in yields since last December when the thirty-year long bond came within a whisker of 2.5%. We have moved up by almost 180 basis points in the last five months and as can be seen we are approaching the 200-week EMA at approximately 4.45%.
The Treasury has substantial supply to clear this week and it is quite likely that dealers have been shorting futures to provide a cushion while they take on the new supply and attempt to distribute it to the large institutional investors. If these institutions begin to choke on the abundant supply the consequences for the global bond markets would not be pretty.
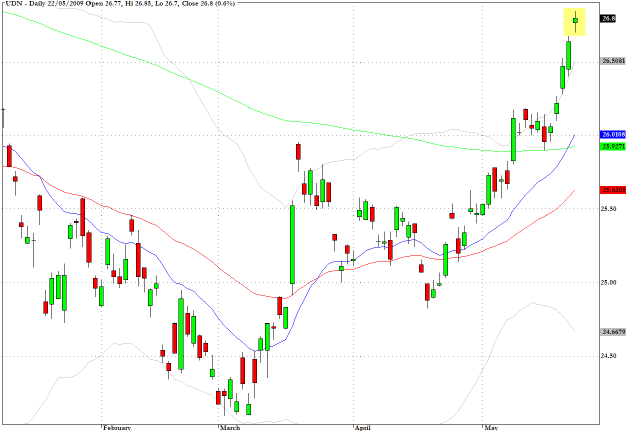
UDN, an inverse tracker for the US Dollar as benchmarked against several major currencies, has reached a possible inflection point as indicated on the chart below. This represents Friday’s close and since then in European trading - especially in Tuesday morning’s session - the Euro and sterling are retracing some of their recent advance.
The dynamics which I have previously outlined here of growing risk appetite and more adventurous allocation to emerging markets and commodities is a negative for the US currency whereas anxiety about the sustainability of the recovery and concerns about the financial climate will tend to be dollar supportive.
If the US dollar has reached an intermediate term recovery level, this would add reinforcement to the view that the equity rally may have run its course in the near term.
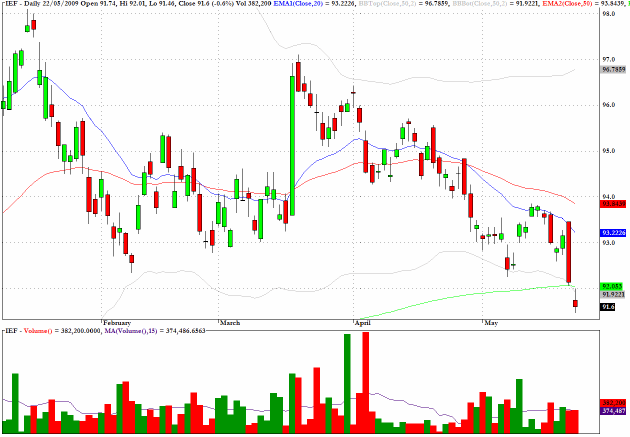
IEF tracks the 7-10 year Treasury curve, and this is the sector of the yield spectrum where much of this week’s supply from the Treasury will fall.
Reviewing the chart one would expect the 200-day EMA to provide some support to prices but if in fact there are difficulties with the auctions and IEF continues downwards this will be unsettling for the markets.
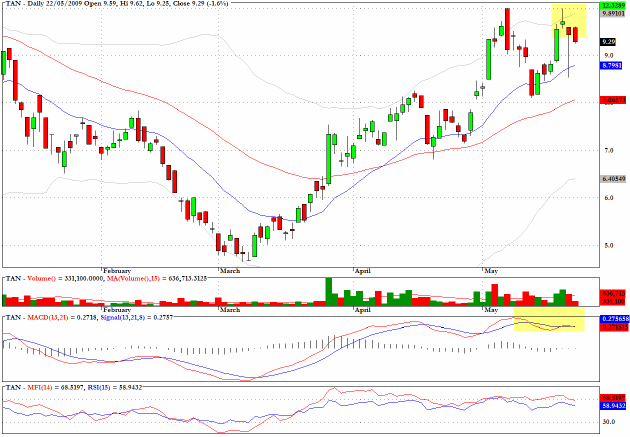
Another interesting sector, which can be played via an ETF, involves the solar energy stocks - traded under the symbol TAN. There is negative momentum evidence and the chart suggests that a correction is emerging.
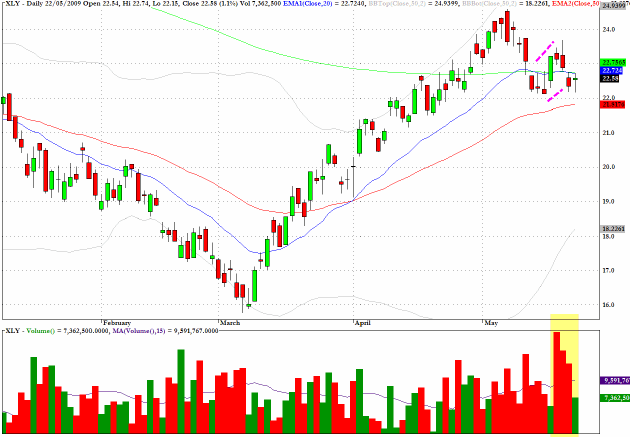
The consumer discretionary stocks, as tracked by XLY, are looking vulnerable and particularly noteworthy is the strong volumes associated with recent corrective action.
Clive Corcoran is the publisher of TradeWithForm.com, which provides daily analysis and commentary on the US stock market.
|