|
The Wagner Daily ETF Report For May 26
Last Friday's session was rather uneventful, as traders showed little commitment to either side of the market ahead of the holiday weekend. Stocks opened near the flat line, traded in a very tight, sideways range throughout the day, then finished modestly lower. The S&P 500, Nasdaq Composite, and Dow Jones Industrial Average all edged 0.2% lower. The small-cap Russell 2000 and S&P Midcap 400 lost 0.8% and 0.5% respectively. The major indices closed near their intraday lows, as well as their lows of the week. Still, the main stock market indexes managed to log small gains for the week.
Not surprisingly, turnover across the board eased substantially. Total volume in the NYSE declined 24%, while trading in the Nasdaq was 29% lighter than the previous day's level. Since volume was already below average levels throughout the whole week, last Friday's substantially slower pace caused the NYSE and Nasdaq to register their lightest volume levels since January 2 of this year. But now that the holiday has passed, one could expect turnover to pick up, especially when stocks make a decisive break away from their narrow trading ranges of the past several days.
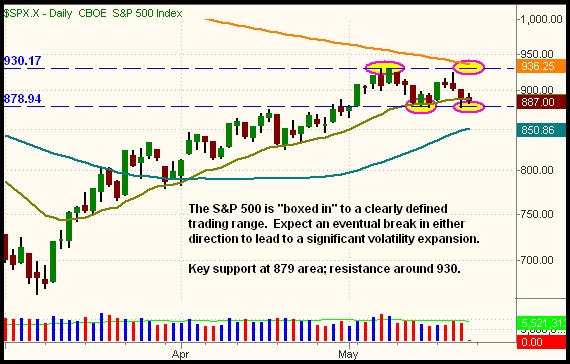
In the May 22 issue of The Wagner Daily, we illustrated how the S&P 500, Nasdaq Composite, and Dow Jones Industrials were all glued to their 20-day exponential moving averages (EMAs). Though the indices moved slightly lower in last Friday's session, the situation remains pretty much the same going into today. However, with trading ranges significantly tightening up over the past several days, we expect to see a key volatility expansion, as prices eventually break out in either direction. Taking an updated look at the daily chart of the S&P 500, notice the pivotal support and resistance levels are now clearly defined:

Last week, the S&P 500 reversed lower after nearing resistance of its prior "swing high" from earlier in the month. Now, the 200-day moving average (the orange line) has also descended to converge with that same "swing high" resistance level. If the S&P manages another rally attempt from here, it will have to contend with the "brick wall" resistance of its 200-day MA, as well as its prior highs from May. As for support, the S&P 500 nominally closed below its 20-day EMA last Friday, but not by a wide enough margin to confirm a break of support. Perhaps more important than the 20-day EMA is the "swing low" support from mid-May, which the index tested on May 21. In summary, there is now clearly defined support at the 879 area, with equally apparent resistance around the 930 level.
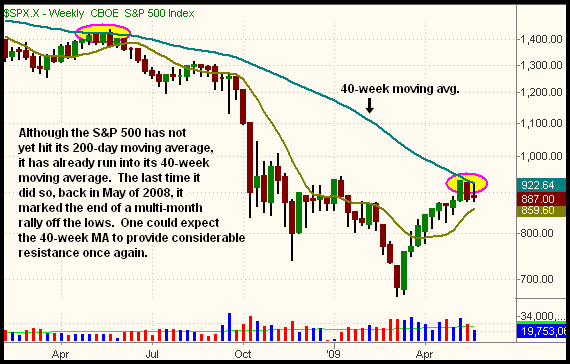
While many traders focus on the daily time interval for charting, the weekly charts often provide insight and a "big picture" not readily apparent on the shorter-term daily charts. While we use the 20, 50, and 200-day moving averages on the daily charts, we primarily follow the 10 and 40-week moving averages on the weekly charts. The 10 and 40-week moving averages give similar, but not exactly the same, readings to the 50 and 200-day moving averages. As an example, take a look at the weekly chart of the S&P 500:

Although the S&P 500 has not yet run into its 200-day moving average, it has already come into resistance of its 40-week moving average. The last time the index touched its 40-week MA, exactly one year ago, it spelled the end of an intermediate-term uptrend that had developed in the preceding months. While we are not implying the 40-week MA will cause the S&P 500 to plunge to a new 52-week low again, there is a strong possibility the 40-week MA will at least trigger a substantial pullback in the market. A 38.2% to 50% Fibonacci retracement, from the March 2009 lows to May 2009 highs, would not be surprising. A 50% retracement would put the S&P 500 near the 800 level.
The longer the S&P 500 remains stuck between its short-term trading range, as illustrated on the first chart above, the more explosive the eventual volatility expansion will be. With the 50-day MA rising up to soon provide support, and the 200-day MA descending to act as resistance, the S&P 500 will be forced to make a decisive break in either direction. In case the breakout is in the opposite direction of any existing, broad-based ETF positions, be prepared to quickly close such positions if necessary. Also, in the event of downside breakdowns to new "swing lows" in the major indices, remember the possible trade opportunities in the inversely correlated Short and UltraShort ETFs from ProShares. Presently, we are already positioned in UltraShort Financials ProShares (SKF), which we bought on May 20.
Open ETF positions:
Long - SLV, FXY, SKF
Short - (none, but SKF is an inversely correlated ETF)
Deron Wagner is the Founder and Head Trader of both Morpheus Capital LP, a U.S. hedge fund, and MorpheusTrading.com, a trader education firm.
|