The homebuilding sector is appearing to discount the effect that higher mortgage rates will have on forward demand for new housing as the technical pattern is giving rise to some concern.
It was not a pretty day for long dated US Treasuries and most especially not for the mortgage backed securities market where rates backed up by an astonishing 45 basis points. The message being sent by fixed income and sovereign debt traders is rather alarming and suggests that the unintended consequences of Quantitative Easing are just beginning to make themselves felt.
The most damage was done at the far end of the Treasury spectrum as revealed by the chart of the Thirty year bond below but a noteworthy jump in yields was seen in the five and ten year maturities as well.
Bloomberg captures the key elements of yesterday's game changing session as follows:
The difference in yields between Treasury two- and 10-year notes widened to a record on concern surging sales of U.S. debt will overwhelm the Federal Reserve’s efforts to keep borrowing costs low.
The so-called yield curve steepened to 2.75 percentage points, surpassing the previous record of 2.74 percentage points set on Aug. 13, 2003. Yields on 10-year notes have risen more than 100 basis points since Fed officials said in March they would buy up to $300 billion of U.S. debt over six months to drive consumer rates down and lift the economy from recession.
“The markets are starting to grapple with the issue of what happens when the Fed exits and the Treasury needs to continue at the same pace,” said David Greenlaw, the chief financial economist in New York at Morgan Stanley, one of the 16 primary dealers that trade with the Fed and are required to bid at government bond auctions.
Until recently many commentators had been dismissing the alarmist talk about the massive challenges confronting capital markets in financing public debt and claimed that the bond markets and the Fed were dealing with matters calmly and methodically.
Given the nature of the public largesse , and this applies equally to governments in the UK, Ireland, Italy, Greece etc. and even at the state level such as California - the mishaps in sovereign debt markets will become an extreme hazard zone and the wearing of crash helmets is strongly advised. 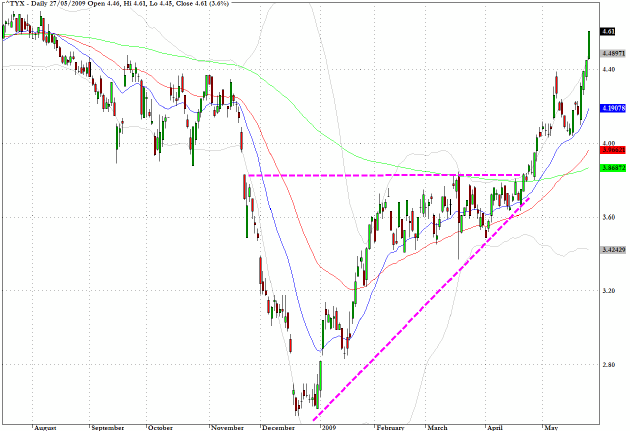
From yesterday's commentary
IEF, tracks the 7-10 year Treasury curve, is the inverse pattern to the 5 year yield chart shown above and as indicated previously a failure to rally following the forthcoming auctions would be a disturbing development for public debt financing.
Question is Can Chairman Bernanke navigate his way through a minefield of gotchas? We shall have to wait and see but it is an unenviable task. 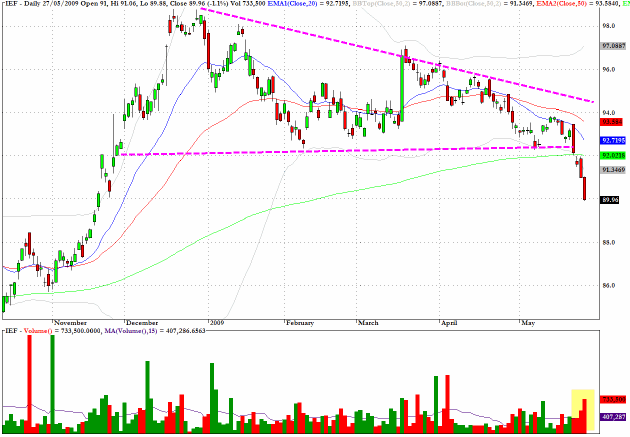
Considering the tumultuous developments in the Treasury and MBS markets yesterday the damage done to the S&P 500, as reflected in the SPY proxy was somewhat subdued.
I remain on the sidelines with broad equity index plays at the moment and will be watching for direction from the Treasury and foreign exchange markets. 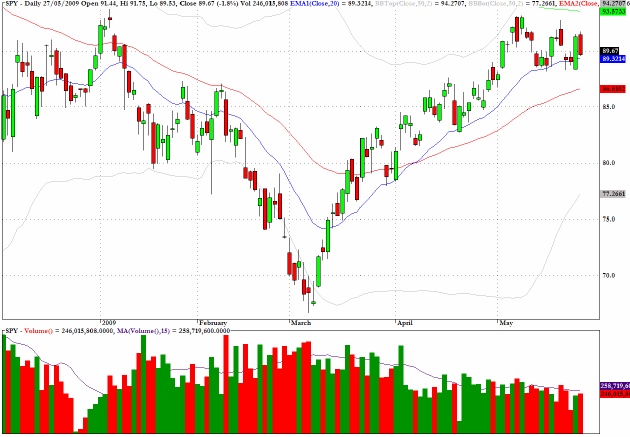
XHB, an exchange traded fund which tracks the homebuilding sector is appearing to discount the effect that higher mortgage rates will have on forward demand for new housing as the technical pattern is giving rise to some concern as a triangular formation is developing with yesterday's close at a pivotal level. 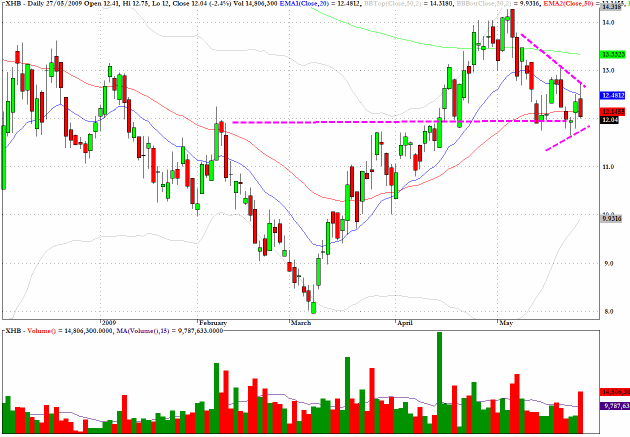
The exchange traded fund, TBT, moves inversely and with twice leverage to the price of 20 plus years Treasuries. In other words it rises with yields and provides a leveraged kicker as well.
This ETF is one of the most efficient ways of playing the short side of the Treasury market and as can be seen this would have been one of the most consistently profitable trades in 2009.
It is often better to stand aside and not chase a market, especially after the dramatic moves of yesterday, but longer term this should be a core holding for a buy and hold investor (assuming that there are still some!). 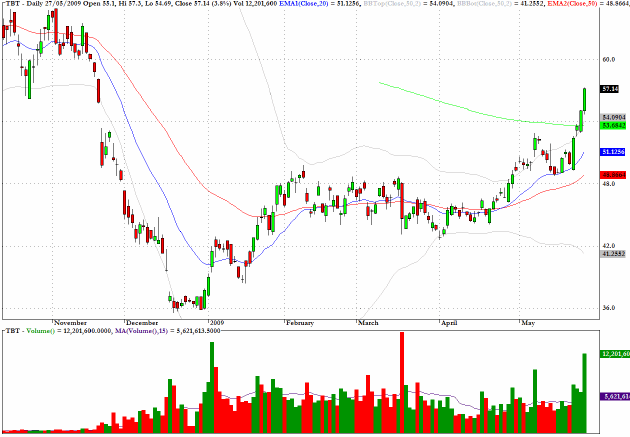
IYT, an exchange traded fund which tracks The Dow Jones Transport Index is developing an elongated bearish flag pattern. 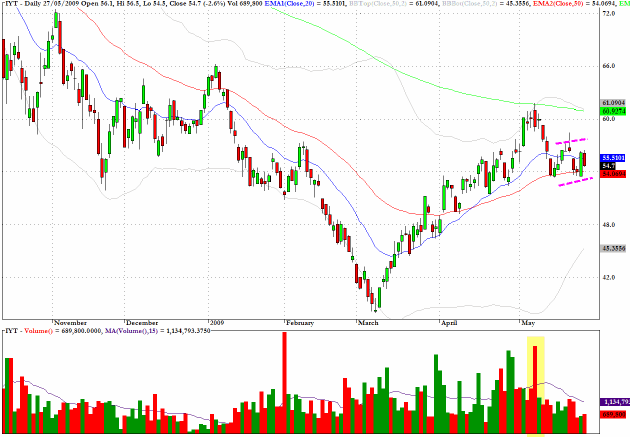
Clive Corcoran is the publisher of TradeWithForm.com, which provides daily analysis and commentary on the US stock market.