Equities are showing a remarkable ability to take on all kinds of negative news in their stride and there have been many suggestions that various vested interests are helping things along.
A late burst of buying in the last minute, several thousand S&P 500 futures contracts were bought at the market, has brought the index to within striking distance of two key strategic levels -- the January 6 intraday high and the 200-day EMA, both of which are in the neighborhood of 945.
Equities are showing a remarkable ability to take on all kinds of negative news in their stride and there have been many suggestions that various vested interests are helping things along. The current market environment seems peculiarly technically driven at present and this will keep me on my toes but with a predilection towards the short side after strategic targets have been hit, which should come in today's session.
Just to touch on the matter of today's GM bankruptcy announcement a sobering number caught my eye this morning.
The current global capacity for automobile production is approximately 100 million vehicles per year and the current demand, which is showing very little sign of improving is only running at about 55 million vehicles per year. The structural over-capacity issues will be with us for a very long time. 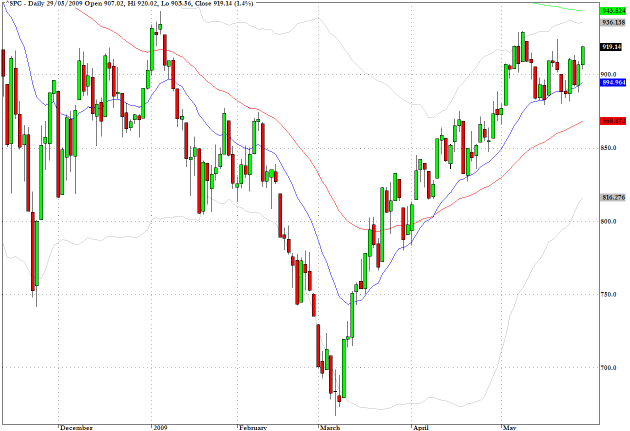
As discussed at the end of last week funds are moving back into commodities in a major fashion and the Rogers Commodity Index continues to surge towards a test of its 200-day EMA. 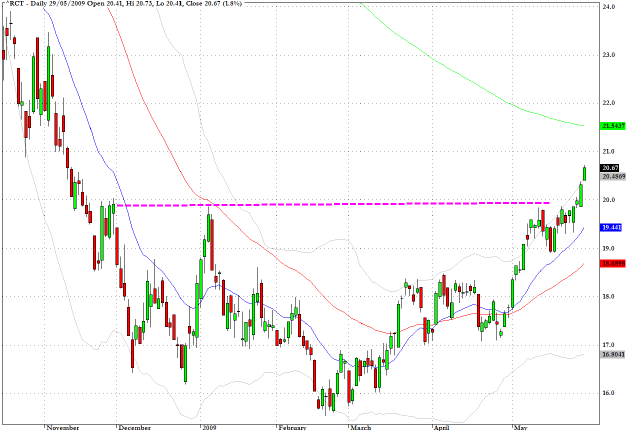
As I am writing this, the DAX in Germany is testing the intraday high seen of 5111 seen in early January. Not that I have a firm view of matters at this stage but I would pass on the comment from another commentator which suggests that the market is awfully well pumped and a dump could be at hand. 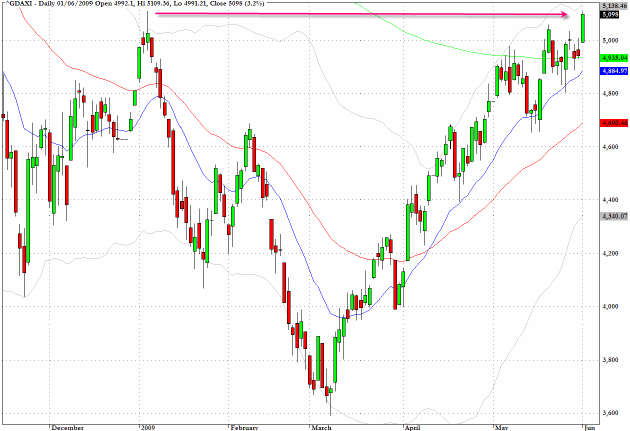
The technical condition of the US dollar as revealed in the ETF which represents a long position on the US Dollar Index is showing signs of accelerated selling.
Increasingly the sale of the greenback against all major currencies - except the Japanese yen - is looking like a one way bet. With Mr. Geithner in Beijing this week and under pressure from the Chinese to maintain a strong currency - could the markets be surprised by a significant policy announcement regarding policy on QE or associated matters?
One thing that can be counted on is that traders will be pushing the limits to test the current Administration's resolve on this issue. 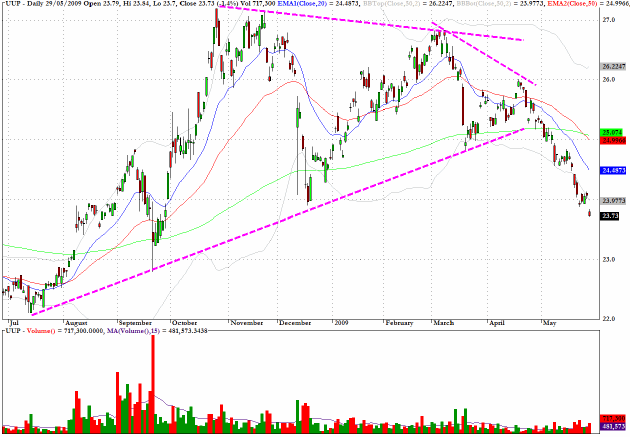
The exchange traded fund, TBT, moves inversely and with twice leverage to the price of 20 plus years Treasuries. In other words it reflects the view of yields and on Friday these moved down rather sharply after the auction activity last week.
As suggested previously such setbacks should be seen as buying opportunities as there are auctions as far as the eye can see. A good point of entry would be as indicated on the chart in the region of $50. 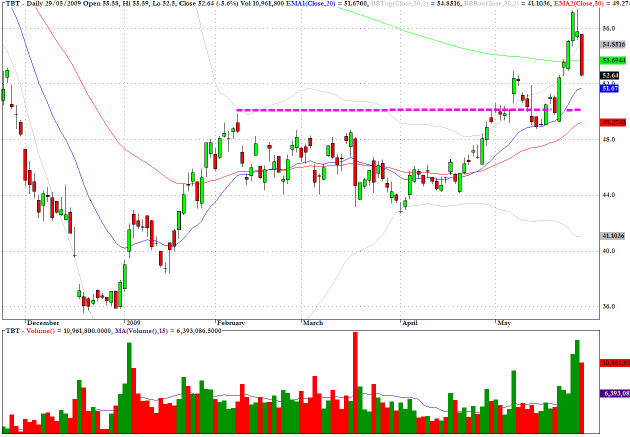
Clive Corcoran is the publisher of TradeWithForm.com, which provides daily analysis and commentary on the US stock market.