NASDAQ COMMENTARY
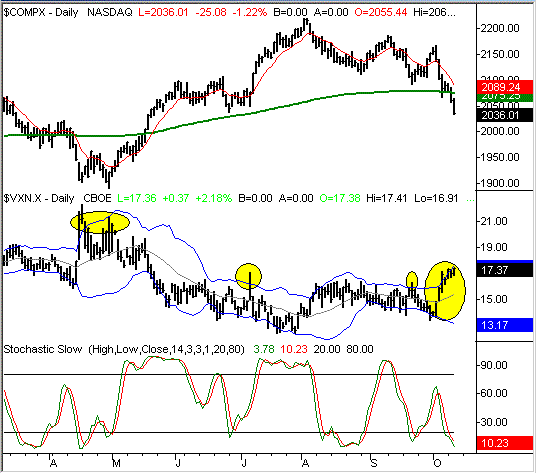
The tech sector's woes continue to plague the tech-heavy NASDAQ Composite, making it the only index deep in the red today.....and not by any small margin either. Oh yeah, don't forget that the NASDAQ is also the only index that's made a low that was way under last week's low as well, and again, by no small margin. The composite is already 25 points under last week's low of 2069.04, and still seems poised to fall even lower. The bottom line is simple - the NASDAQ is ugly right now. What's next? There are a couple of things we can look for, and there's one thing we should be on the lookout for.
From the bears point of view, we've already seen one of the most important sell signals you can get - cross under the 200 day moving average (green). This happened yesterday, and barring any huge turnarounds before the end of today's trading, we'll get the second (and confirming) piece of that sell signal today.
The thing is, despite the fact that we've repeated this for days while the market was continually telling us otherwise, we're still hesitant to think that we can go much - if any - lower. We're way oversold as it is, and there are some sentiment indications that are telling us we're close to hitting a proverbial wall. On the chart below, we've added the NASDAQ's Volatility Index (VXN) to show you how sentiment has runup to an extreme reading. The VXN surged a few days ago, but the upper Bollinger band slowed that move down to almost a standstill. As the chart shows, this is about the point when stocks start to turn higher again, as the VXN rolls over. This, combined with the way we're well into stochastic oversold territory, is likely to put upward pressure on stocks.
All the same, right now, the trend is bearish....and seems to be getting even more bearish, so from a momentum perspective we have to side with the bears. From a realistic perspective, though, something has to give soon. If the bulls make a rally attempt and fail, then we can justify new bearish or short trades. But as tightly as the spring is coiled right now, jumping on the bearish bandwagon could just be dangerous. Plus, this recent action has capitulation qualities that often precede a bigger move higher.
NASDAQ CHART - DAILY

S&P 500 COMMENTARY
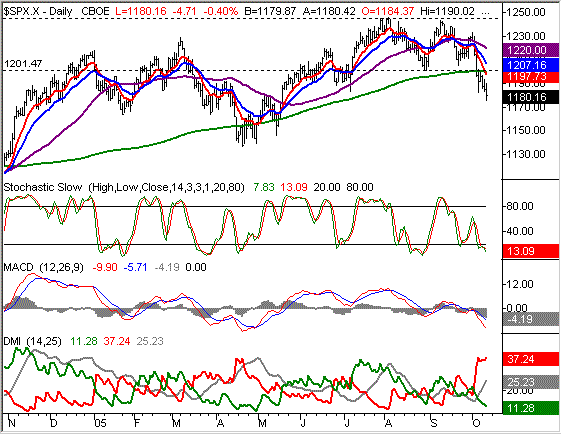
The S&P 500 was already under its 200 day line (green), as well as a fairly important support level, both of which were parked around 1200. In that sense, and like the NASDAQ, we have a meaningful sell signal. However, the story is still the same - it's unlikely that the selling can continue at this pace. We'd rather see what happens when the selling finally does ease up before making our next move.
Why aren't we all that worried about the tumble under the important 200 day moving average? Go back to April. The SPX fell under it for a few days, but it ended up only being the calm before a bullish storm. Will we get that again? Maybe, maybe not. We're just saying that this particular moving average, as with all the key moving average lines, hasn't really meant a whole lot this year. We're still watching them, but we've been better served by reversal-based signals than we have by momentum-based signals.
As regular readers will know, one of our key reversal-based indicators is the stochastics tool. This year, it has been outstanding at spotting the points in time when stocks were oversold and ripe for a reversal. Notice, however, that we didn't say it was effective at spotting the very beginning such an upside bounce.
The downside of stochastics is that markets can get into an oversold status, but stay there for a long period of time. To combat that issue, we wait for the stochastic lines to come up out of the oversold threshold (above the 20 line) to signal an actual recovery. In this year's choppy, reversal-prone environment, we've found this to be a very useful application. That's also why we're not yet bullish though. The S&P 500 is ripe for an upside move, but we don't have any indication that's it's going to start at any particular time. All we can say is stocks haven't stayed oversold for more than a couple of weeks this year before they recovered. And with the degree of selling we've seen in just the past week alone, it's very likely that the number of sellers is growing very thin. That leaves only buyers waiting in the wings.
S&P 500 CHART - DAILY

DOW JONES INDUSTRIAL AVERAGE COMMENTARY
Where the other two indexes look to be struggling, the Dow has actually done a decent job of holding its own. That's largely in part because of the mix of the 30 Dow stocks, which tends to overweight in the industrial and financial, and underweights oil by a little. All the same, this index and at least some of the components of it aren't the complete disaster that most other stocks seem to be at this time.
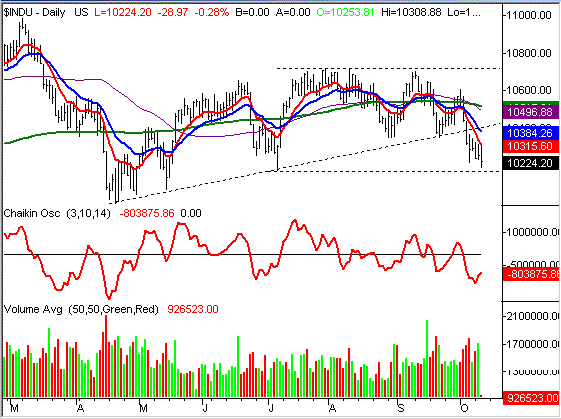
The Dow was the only major index to close higher yesterday, but the fact this it did so on higher volume says quite a bit. The big challenge here is going to be the 10 day line, which was tested with today's high of 10.308. In fact, the Dow has been trailing right under the 10 day line since Monday. Investors are tempted by these blue-chips, but are likely seeing the pain in the rest of the market, and are unwilling to jump into these large-cap names at this time. But there is at least enough interest here to keep the index afloat after last week's beating.
While the 10 day average at 10,317 is the first line in the sand, we'd really like to see the Dow get back above all its key averages before getting really excited. The uppermost one is the 200 day line (green), currently at 10,500. Anything short of that is just going to leave the Dow stuck in the mud, as it has been for most of the year. As for support, we're drawing it at 10,175. That's the low from July that ended up sparking a rather nice bullish move, and it's definitely worth watching - today's low is 10,193. In the meantime, sit tight and let the market tip its hand before you play your cards.
DOW JONES INDUSTRIAL AVERAGE CHART - DAILY

Price Headley is the founder and chief analyst of BigTrends.com.