| Corcoran Technical Trading Patterns For June 4 |
| By Clive Corcoran |
Published
06/4/2009
|
Stocks
|
Unrated
|
|
|
|
Corcoran Technical Trading Patterns For June 4
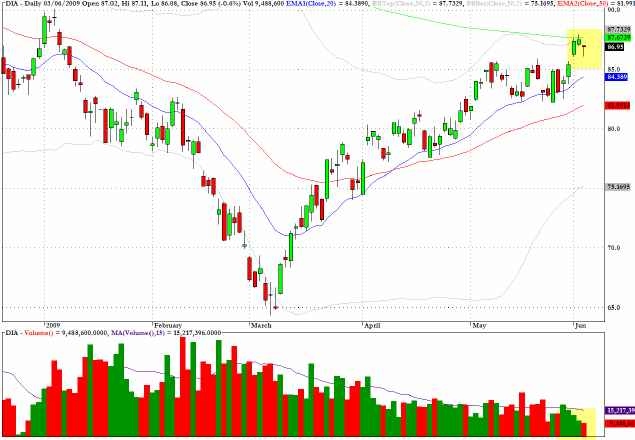
The Dow Jones Industrials Average Cash Index has still not managed to confront the 200-day EMA which currently has a value of 8860.
The exchange traded proxy, DIA, has tagged its 200-day EMA twice in the last three sessions, but is also revealing some tiny range candlesticks (including a hanging man candlestick yesterday) on declining volume with the possibility of a lower high being registered than that seen in January.
The index is undergoing transition as GM and Citigroup (C) make way for Travelers (TRV) and Cisco (CSCO) but it is still worth paying close attention to the Dow as it is still the most widely quoted index in the global capital markets.
I continue to remain cautious about equities and see the reward/risk ratio on the long side as becoming more problematic as an increasing number of market pundits seem to be focused on the long term sustainability of current public deficit levels.
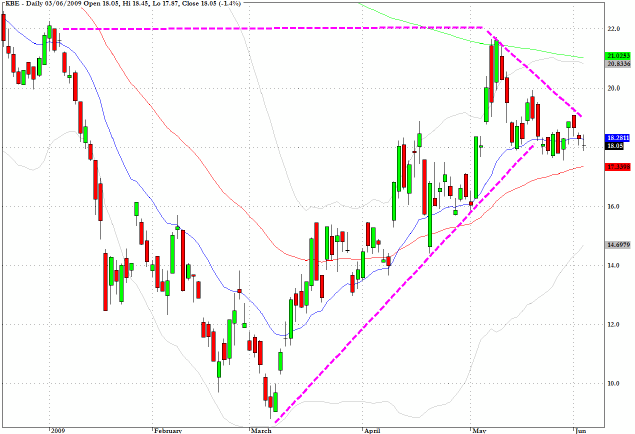
KBE, the exchange traded fund which corresponds to the performance of the KBW Banking index, is moving sideways after a violation of the up-trending line through the lows since March.
While, and until, this index is unable to rally further out of the congestion zone this may keep the overall equity market in a waiting pattern.
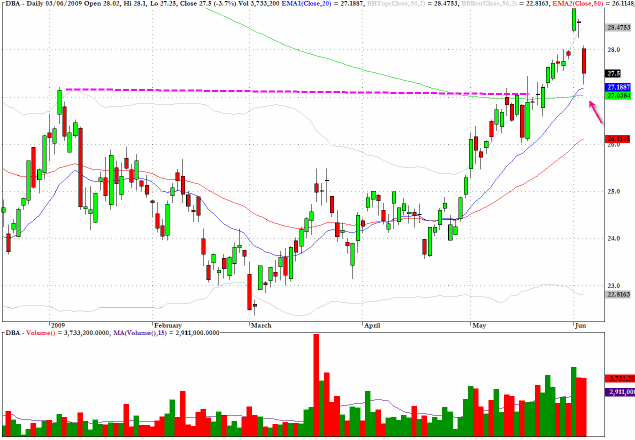
As anticipated in Tuesday’s commentary commodity indices ran into resistance at exactly their 200-day EMA levels. DBC, cited in my last column, dropped back 3.3% yesterday.
The fund which I will be monitoring for entry opportunities on the long side is DBA which tracks the price of key agricultural commodities.
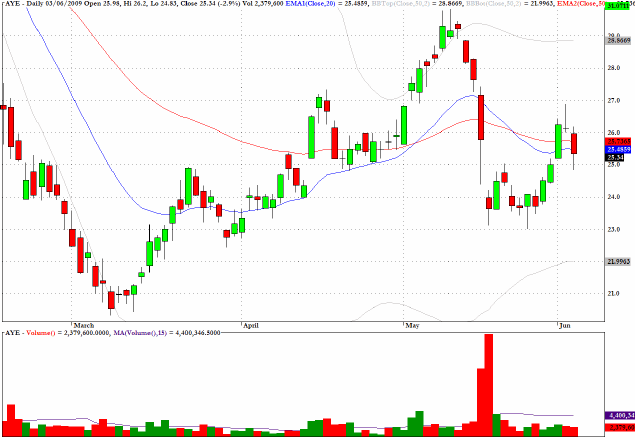
Allegheney (AYE) has pulled back following a recent drop on substantial volume and could be vulnerable to further weakness near the $27 level.
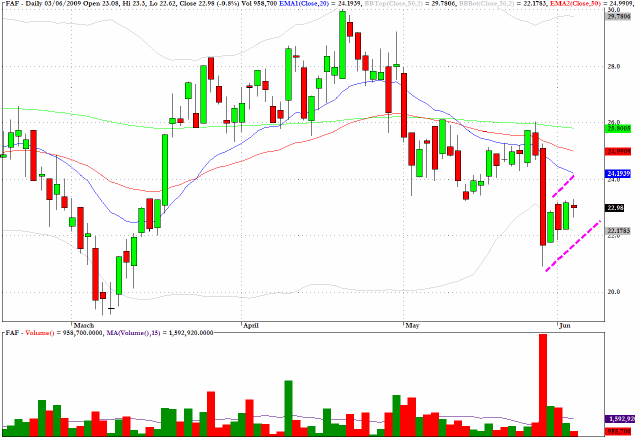
First American (FAF) is also developing a bearish pullback pattern.
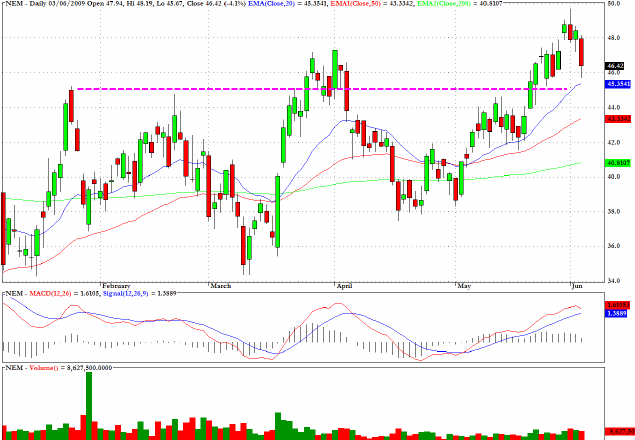
Newmont Mining (NEM) would become attractive on the long side around $45.
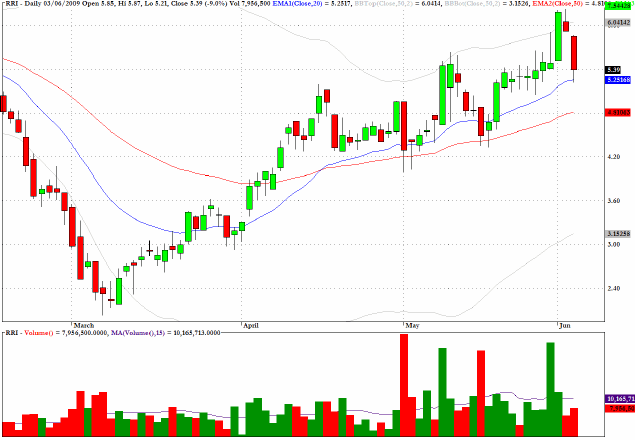
Reliant Energy (RRI) dropped by 9% yesterday but on much reduced volume. Potentially this could retreat to the 50-day EMA at $4.50 at which price it would be appealing on the long side.
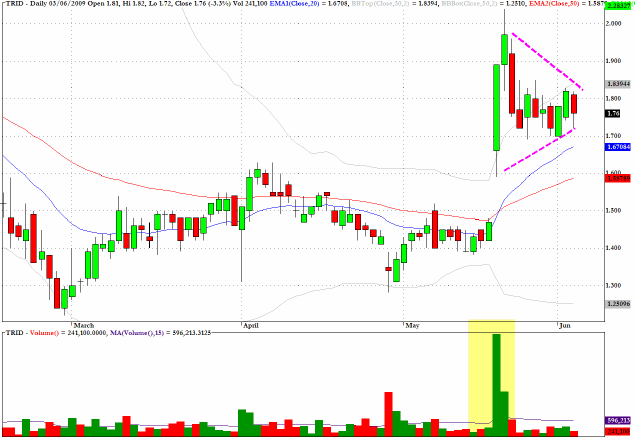
Trident Microsystems (TRID) has a pennant formation and could break away to the upside as suggested by the positive volume characteristics.
Clive Corcoran is the publisher of TradeWithForm.com, which provides daily analysis and commentary on the US stock market.
|