| The McMillan Options Strategist Weekly |
| By Lawrence G. McMillan |
Published
06/5/2009
|
Options
|
Unrated
|
|
|
|
The McMillan Options Strategist Weekly
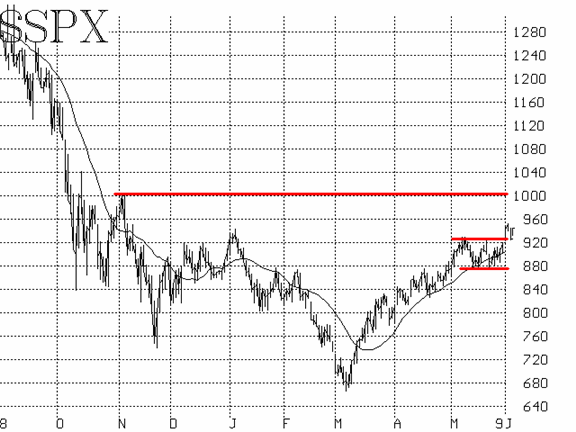
$SPX broke out to the upside on Monday, easily overcoming the various resistance levels (January highs, May highs, and 200-day moving average). It then proceeded to pull back and test the breakout successfully, before advancing again today. Since none of our indicators are on sell signals, the path of least resistance is to the upside.

The 920-930 level now represents support (Wednesday's pullback reached a low of 923). Below that is the 20-day moving average, near 910. A violation of that average would be unpleasant in that it would indicate that the upside breakout was false. However, that wouldn't necessarily end the bullish phase that the market is currently in. A close below 880, however, would turn the picture negative.

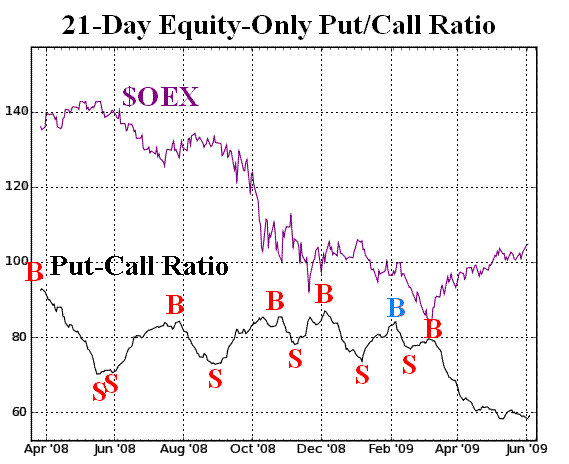
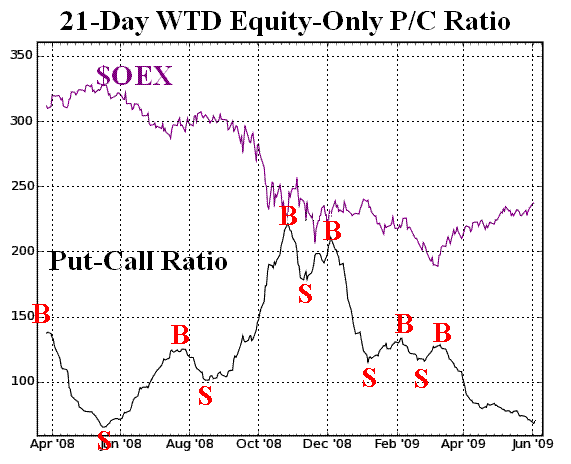
The equity-only put-call ratios remain on buy signals, even as they are at very low levels on their charts. They will remain bullish as long as the ratios continue to decline. Only an upturn in the ratios would generate sell signals.

Market breadth moved back into overbought territory with Monday's large upside breakout day. The number of individual stocks that simultaneously broke out to new relative highs was extremely large. This is bullish action.

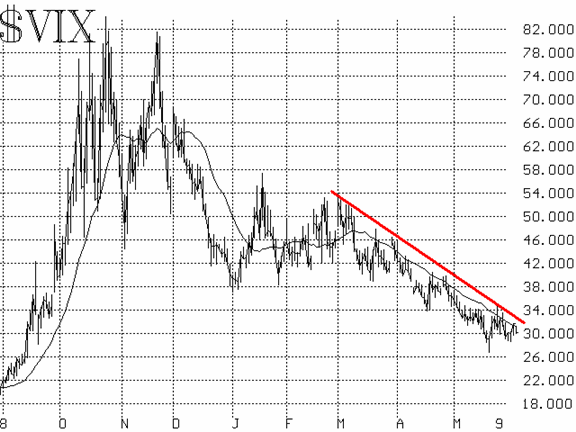
Volatility indices continue to decline, in general. That is bullish as well. $VIX remains near 30, which is still a very lofty level (which is why the daily movements in $SPX are still quite large). But as long as it continues to trend lower, it will remain on a buy signal.
In summary, the situation remains bullish, although overbought conditions indicate that sharp, but short-lived declines are possible at any time.
Lawrence G. McMillan is the author of two best selling books on options, including Options as a Strategic Investment, recognized as essential resources for any serious option trader's library.
|