| Corcoran Technical Trading Patterns For June 10 |
| By Clive Corcoran |
Published
06/9/2009
|
Stocks
|
Unrated
|
|
|
|
Corcoran Technical Trading Patterns For June 10
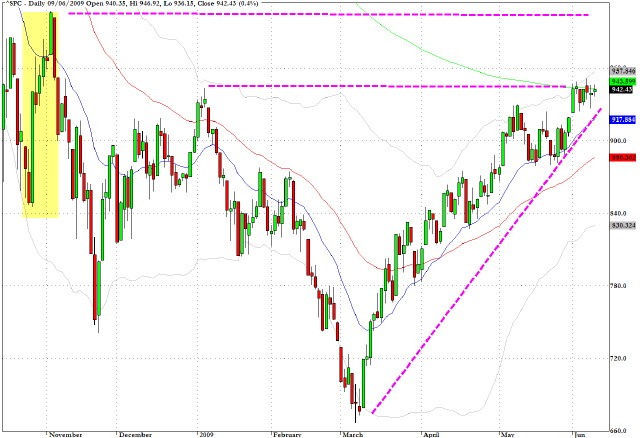
A couple of weeks ago I pointed to the view that the 945 level on the S&P 500 was a fairly critical one. Over the last few sessions we have been above it but the index still has to break away decisively from this attractor price zone.
As can be seen, the next target for the bulls will be the 1000 level which was the reaction high in early November from the doomsday news at the time regarding the banking sector.
The main hurdle to be overcome in the next couple of sessions will be the level of interest and the yields required to auction 10 and 30-year Treasuries. If that can be done without drama, this should present the bulls with the best excuse that they may have for a run at 1000.
Needless to say, the index has boxed itself in well and a break below the very steep upward trendline from the early March low on heavy volume would completely alter the intermediate term outlook.
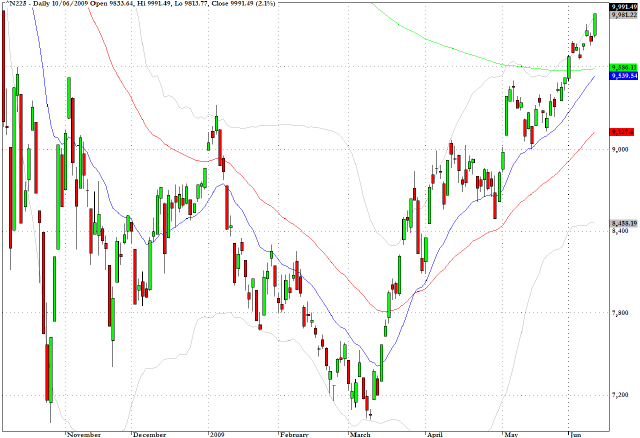
The Nikkei 225 (N225) concluded trading in Tokyo on Wednesday just 9 points shy of the psychologically important 10,000 level.
One very strong positive correlation which I have previously noted in this column is the rather intriguing one between the yield on the 10-year US Treasury note and the Nikkei 225. Once again it seems that the correlation is proving to be reliable and, as yields march upwards, so the Nikkei continues its upward moves.
I would expect a pause in the upward drift of yields at or close to 4% and that could be an indicator that the Nikkei may also need to pause to refresh (not that there is any causative relationship implied by strong correlation).
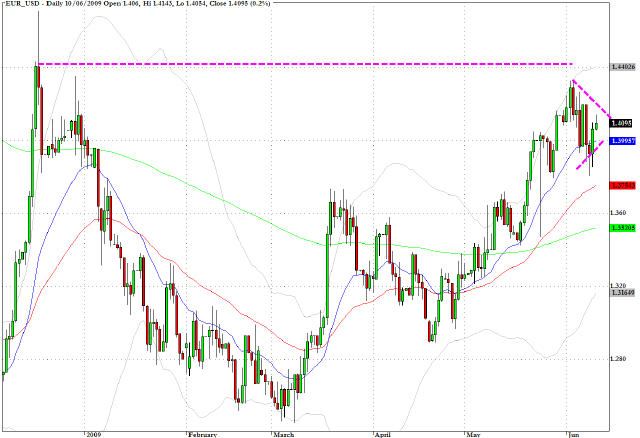
The Euro may be trying one further effort to revisit the $1.45 level last seen in December but a third failed attempt to do so with another lower high being registered would suggest that the underpinnings for the currency are not primarily bullish.
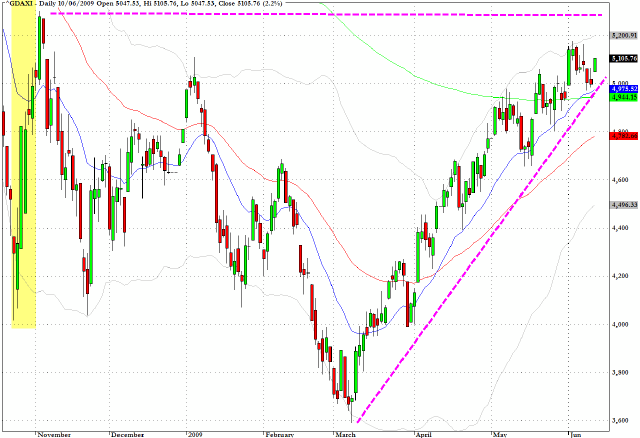
In parallel with the chart above for the S&P 500, the DAX index in Germany, already ahead by about two percent in European trading today, could be headed towards 5300 which was the early November reaction high as highlighted in yellow on the chart.
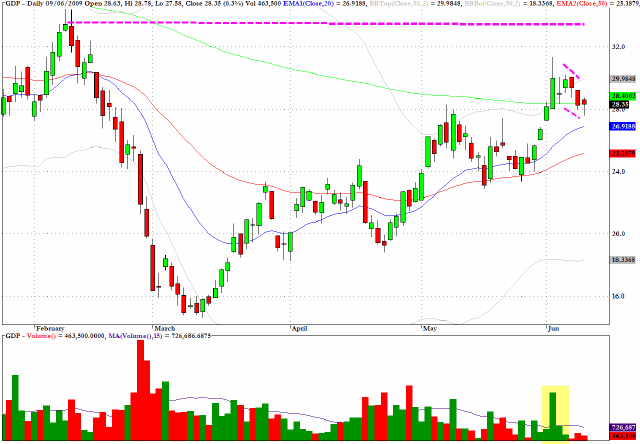
A likely intermediate term price target for Goodrich Petroleum (GDP) would be at the early February levels near to $33.40.
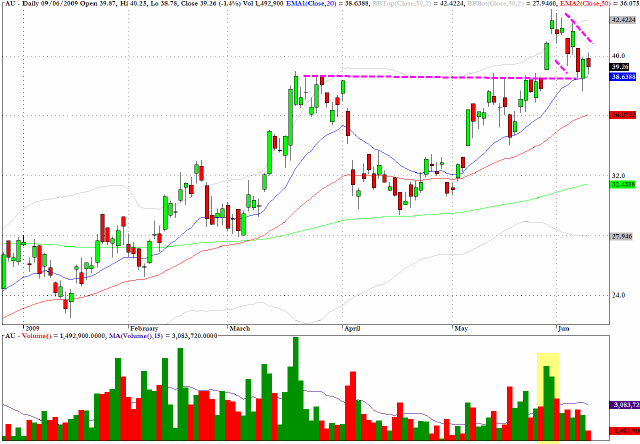
AngloAmerican Gold (AU) should find price support in the region of $38 in the context of a bullish pullback pattern.
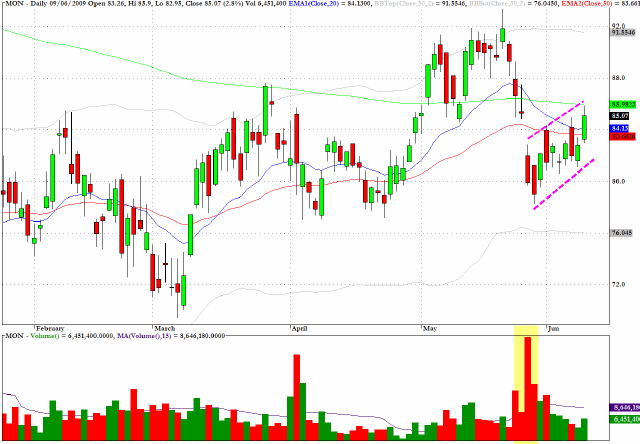
Monsanto (MON) has retraced most of the plunge from two weeks ago and appears vulnerable to renewed weakness near current levels.
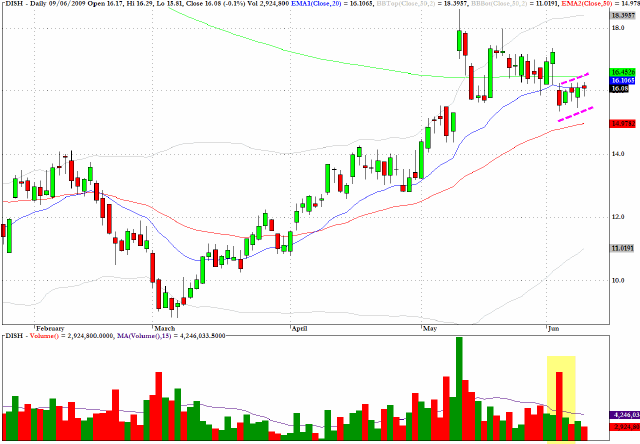
Echostar Communications (DISH) has a bear flag formation.
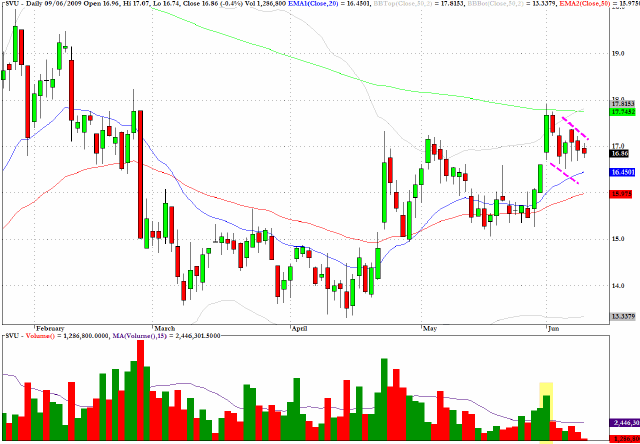
SuperValu (SVU) has a bullish flag formation and a target at the 200-day EMA around $18 would seem to be feasible.
Clive Corcoran is the publisher of TradeWithForm.com, which provides daily analysis and commentary on the US stock market.
|