| Corcoran Technical Trading Patterns For June 11 |
| By Clive Corcoran |
Published
06/11/2009
|
Stocks
|
Unrated
|
|
|
|
Corcoran Technical Trading Patterns For June 11
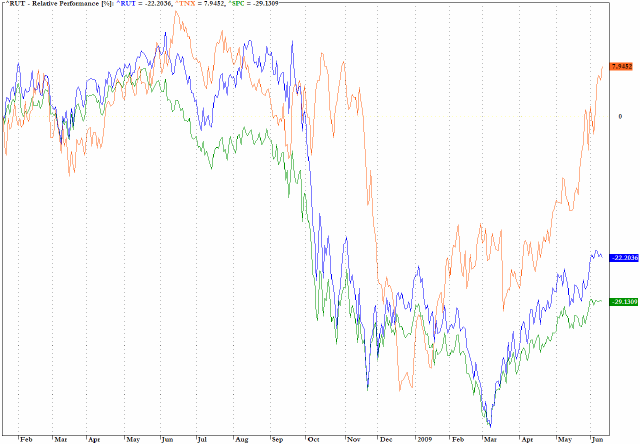
Two themes that I am currently focused on are the big moves in yields at the long end of the Treasury spectrum - to be followed soon by equally big moves at the shorter end - 2 years? - and the relative out-performance of the small cap stocks against those in the S&P 500.
Since the March lows, the best way to understand the price action in US equities, I would suggest, has been one where macro asset allocators have been using high frequency sector rotation strategies designed to effectively seek out some complex arbitrage maneuvers by being long the high beta performers (Russell index) and short the lower beta stocks (S&P 500).
This type of action is entirely consistent with the overall theme of building a base for acceptance by the consensus that there is a new bull market in US equities - indeed it characterized much of the trading activity in the 2004-6 period.
The unfortunate piece of the puzzle is shown by the rather shocking under-performance, from the perspective of price, of US Ten-Year notes - as indicated by the very sharp backup in yields reflected on the relative performance chart below.
After a poorly received ten year auction yesterday, the yield has effectively doubled since the historic low yields around two percent seen at the end of 2008.
Sector rotation arbitrage has certainly succeeded in giving an overall lift to equity prices and sentiment, but the chart below should act as a sober reminder that - given the magnitude of the US Treasury’s borrowing requirements - the tried and true formula of pumping up prices to create a sale for equities may have more surprises to contend with this time around.

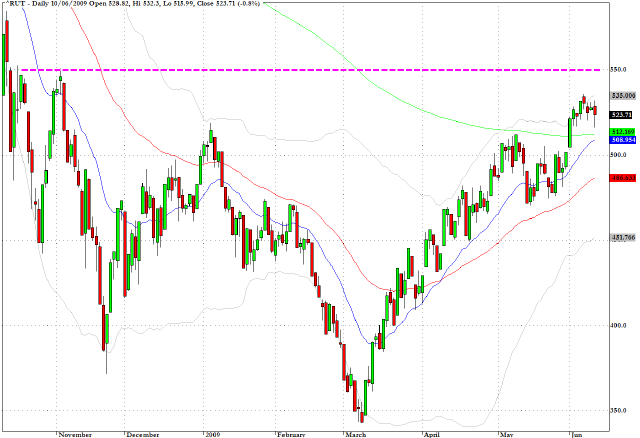
The Russell 2000 (^RUT) is starting to look a little less convincing in relation to the asset reflation story touched on above and the long IWM/short SPY rotation play has to be monitored for potential reversal as if there is to be a chink in the armor, the IWM leg - the high beta component of the spread - has the potential to fall much faster than the SPY leg.
Meanwhile, 550 would seem to the intermediate term target on the Russell 2000 and 1000 on the S&P 500.

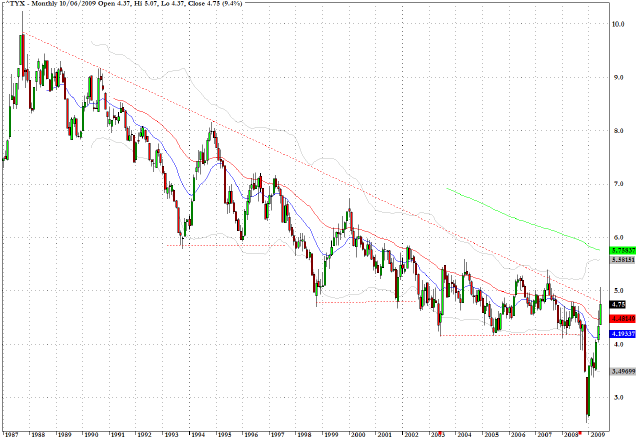
The Treasury market will probably have another nervous session today as there is an auction of 30-year bonds. As can be seen from the very long-term chart shown below, the 30-year yield spiked up to almost five percent yesterday.
If the yields required to sell all of the long maturity debt do not find some support in the five percent region, there would be a plausible case to be made that a confirmed violation of the downtrend through yields stretching all the way back to 1987 creates a new monetary environment for the Fed which will "complicate" the rebuilding of confidence in US equities as a desirable asset class.
Whether emerging market equities can decouple, longer term, from the fortunes of the US equity ETF’s remains to be seen - but an increasing number of hedge funds are expressing their preference by eagerly pursuing the China/reflation agenda which has been discussed here recently.

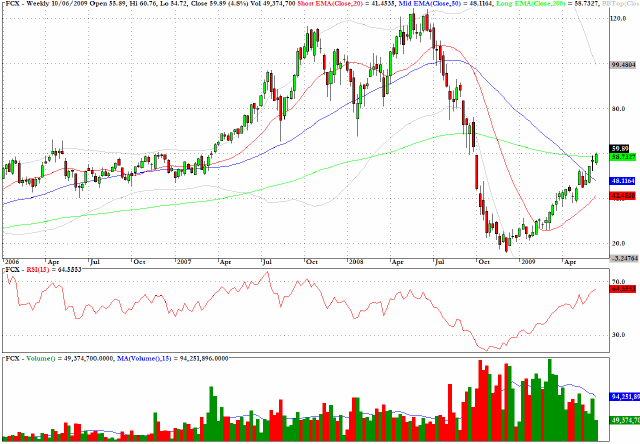
Freeport McMorran (FCX) is a good barometer stock for revealing the enormous new appetite for commodity-related equities. The weekly chart below shows how this stock has more than tripled since the lows seen last fall.
The $60-65 region, which marks yesterday’s close, coincides with some potential resistance from previous support resistance levels and the 200-week EMA. There may be further gains ahead but the risk/reward ratio is becoming less attractive for this play.

Clive Corcoran is the publisher of TradeWithForm.com, which provides daily analysis and commentary on the US stock market.
|