| Corcoran Technical Trading Patterns For June 12 |
| By Clive Corcoran |
Published
06/12/2009
|
Stocks
|
Unrated
|
|
|
|
Corcoran Technical Trading Patterns For June 12
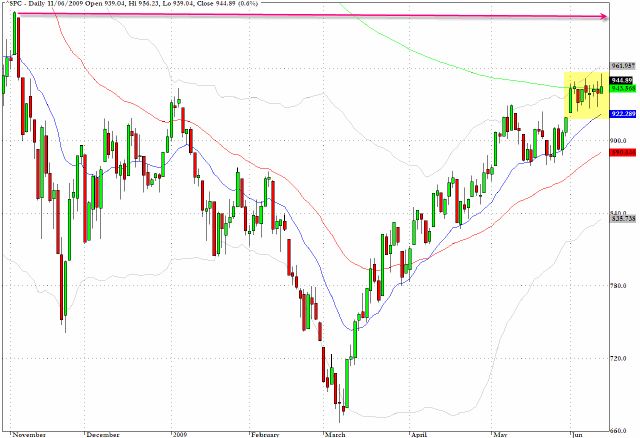
The S&P 500 is still sticking like glue to the 945-50 level despite reaching up yesterday to a new intraday high for the year.
Unlike the Nasdaq 100 and the Russell 2000, neither the S&P 500 or the Dow Jones Industrials have witnessed the bullish 50/200 cross where the 50-day EMA penetrates above the 200-day EMA from below.
The sideways pattern since first reaching 945 has now lasted for nine days and the momentum indicators are beginning to wane. However, the 1000 level still seems to be a target that may prove too tempting for both the bulls and bears to resist.
Several readers have inquired whether I intend to offer any courses/mentoring programs. At present I have been engaged by the International Capital Markets Association to offer a course in Technical Analysis and this course can be convened in a variety of international locations. Details of the course can be found here or by sending me a direct e-mail.
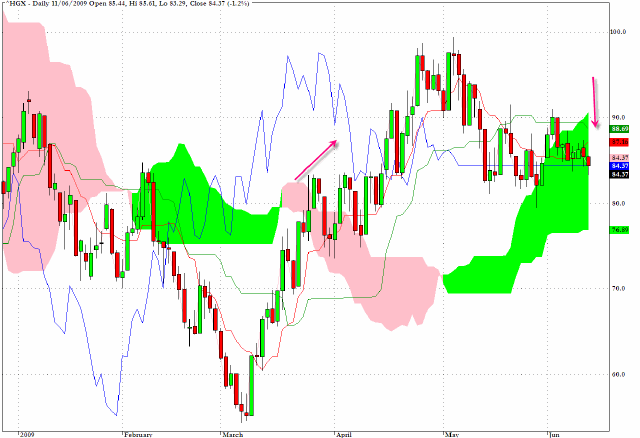
The Housing Index (HGX) is one of the "heaviest" looking of the broad sector indices and undoubtedly the recent surge in long-term rates and MBS rates is weighing on this market.
The Ichimoku chart reveals the manner in which price action is now entering the green cloud to the right of the chart and the potential for downside follow-through if the price drops out of the cloud. Also worth noting is the manner in which the piercing of the pink cloud from below in early April (and annotated with the arrow) was a good buy signal for this index.
Anecdotally the following quote from a Bloomberg article captures the core issue for the mortgage refi market.
“The homeowner can’t handle this,” said Scott Simon, the head of mortgage-bond investing at Pacific Investment Management Co., whose Newport Beach, California-based firm is the world’s largest fixed-income manager.
Higher rates are “really hurting the refi wave,” Buchta said in a telephone interview. “And rising rates are definitely going to hurt home prices. Consumers figure out the payment they can afford and from that figure out how much house they can buy.”
An increase of 0.5 percentage point in loan rates translates into about 5 percent “less buying power,” he said.
It’s becoming more obvious to a number of analysts that the Fed is losing control of long-term rates, and sometimes it is useful to quote from other newsletters - this one from Michael Shedlock.
Fed Is Out Of Control
What now Big Ben? You’ve already blown over a third of your $1.25 trillion commitment and all you have to show for it is more garbage on your balance sheet and a locked up refi market.
One thing is clear, Ben Bernanke and the Fed have lost control of the mortgage market (not that the Fed was ever in control in the first place). They weren’t. It was all an illusion.
For now, the stock market is shrugging this off. If rates stay above 5.5% for long, don’t expect that to last. And it may not last anyway.
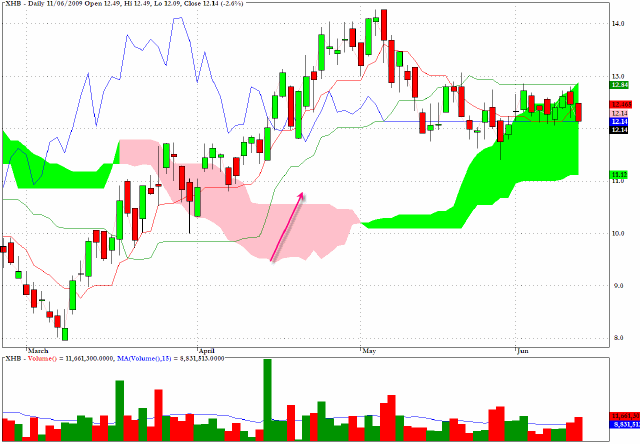
XHB, an exchange traded fund which tracks the homebuilding sector, is revealing a pattern similar to that of the Housing Index on the Ichimoku chart below.
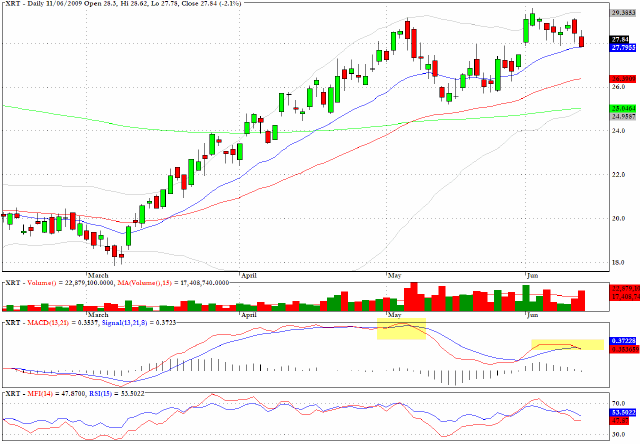
XRT, the SPDR version of a sector fund which tracks retail, is revealing some negative momentum divergences.
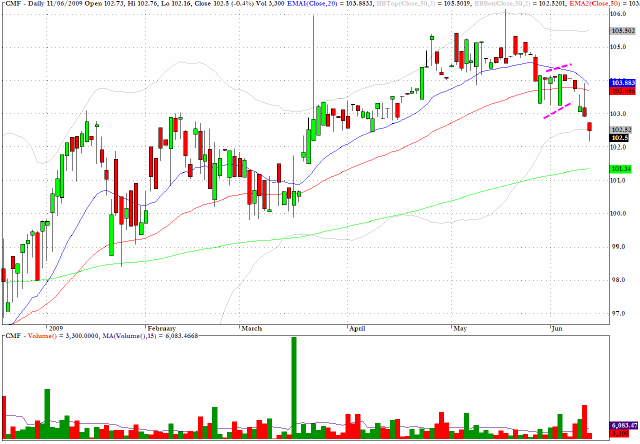
CMF is a fairly specialized exchange traded fund which tracks municipal debt for the state of California. After appearing to be unruffled by that state’s current calamitous budget situation, the last two days have seen selling emerge in this fund and the path looks clear for further downside pressure.
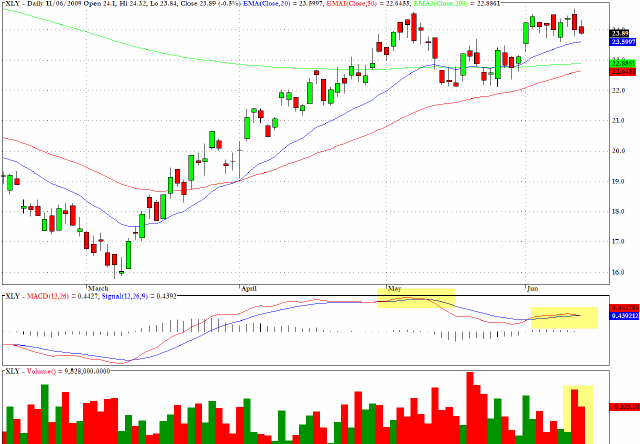
The consumer discretionary stocks, as tracked by XLY, are revealing some negative MACD divergences and also noteworthy is the pickup in volume associated with the inability to break above the high from early May.
Clive Corcoran is the publisher of TradeWithForm.com, which provides daily analysis and commentary on the US stock market.
|