| The McMillan Options Strategist Weekly |
| By Lawrence G. McMillan |
Published
06/12/2009
|
Options
|
Unrated
|
|
|
|
The McMillan Options Strategist Weekly
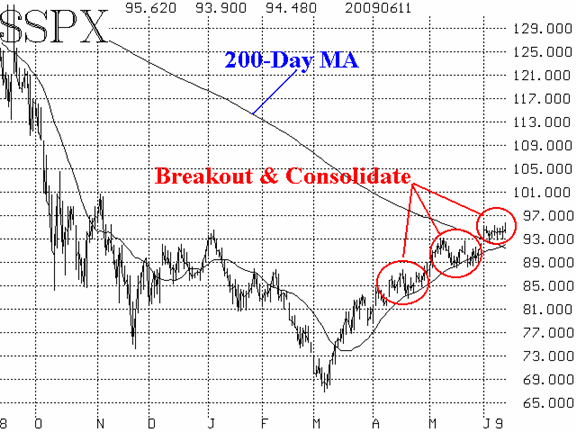
The broad market broke out to new highs again today, although it struggled to hold those gains by the close. The first part of this ongoing rally was characterized by pretty much straight-up action. Since then there has been a series of breakouts, followed by consolidations and then further breakouts. These are marked on the chart on Figure 1. This stair-step advance has been quite orderly in that each consolidation area has provided support for the next breakout. Thus, the 945-950 area should now be support, followed by previous consolidation tops at 920-930, and then 870-880.

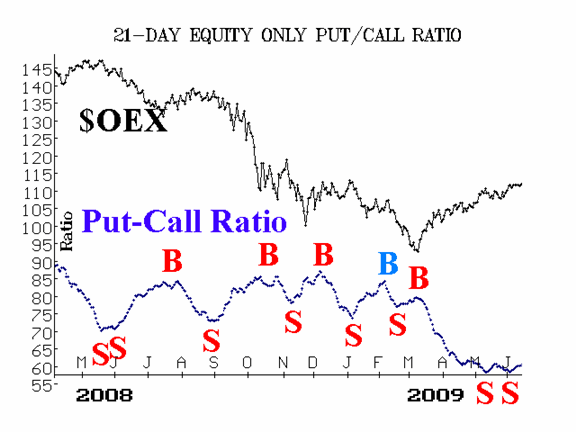
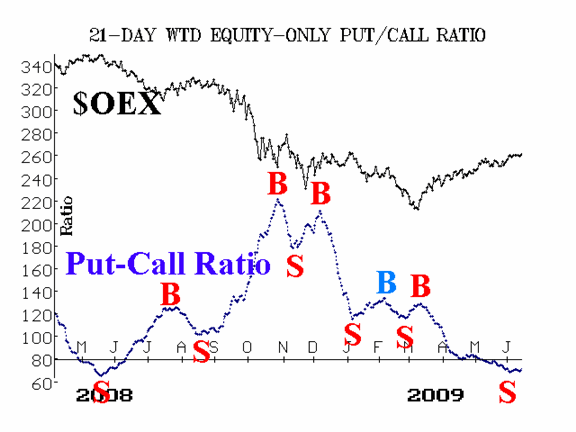
Sell signals occurred in the equity-only put-call ratios, but recent action has put those sell signals in doubt. In any case, the weighted ratio seems to be a little less susceptible to these false wiggles, and so perhaps it is the one which should be given the most credence now.

Market breadth has generally been positive, continuously remaining in overbought territory since late May -- and generally remaining in overbought territory since mid-March. Such long periods of overbought activity are bullish, in that they signify a strong and wide participation of stocks in the rally.

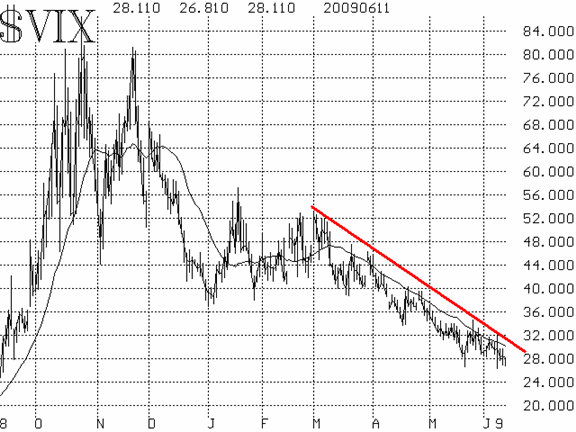
Volatility indices ($VIX and $VXO) remain bullish also, because they are declining steadily. As long as they remain below their declining trend lines and declining 20-day moving averages, that is bullish for the stock market. A close above 32 by $VIX would be bearish, but that seems quite unlikely at any time soon. $VIX is near 27.50, and the actual 20-day historical volatility -- often closely associated with $VIX -- is below 25. So there is a downward "pull" on $VIX in that regard.

In summary, the outlook is bullish as long as $SPX remains above support.
Lawrence G. McMillan is the author of two best selling books on options, including Options as a Strategic Investment, recognized as essential resources for any serious option trader's library.
|