| Corcoran Technical Trading Patterns For June 16 |
| By Clive Corcoran |
Published
06/16/2009
|
Stocks
|
Unrated
|
|
|
|
Corcoran Technical Trading Patterns For June 16
Yesterday’s sell-off in the US followed on from weakness in Asia and Europe and, as discussed in yesterday’s commentary, a contributory factor was the much firmer tone to the US dollar.
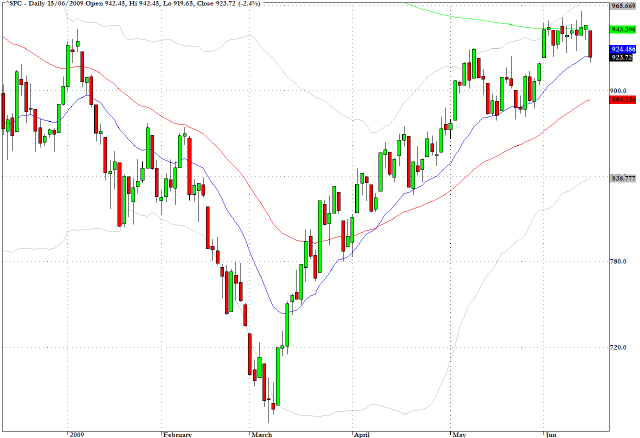
The price action in the widely followed US indices did not violate key support levels. The S&P 500 managed to close off of its low for the session and, as can be seen on the chart below, right at the 20-day EMA level.
The volume was about average for the session and it would be too hasty, in my opinion, to read too much into the selling.
While writing this, the euro is trading in Europe around the $1.39 level and has held its ground above the $1.38 pivot point. As previously indicated the action in the currencies can often be a useful indicator as to shifts in asset allocation and we would need to witness a much greater flight to the dollar as a safe haven before we start writing an obituary to the three-month rally.
Worth paying attention to with respect to the euro is the following from the FT’s Lex column this morning.
European banks are a source of nervousness to policymakers around the world. The eurozone economy is flat on its back. Growth will be between minus 4.1 per cent and minus 5.1 per cent this year, recovering to perhaps minus 1.0 per cent and 0.4 per cent next. With the negative feedback loop between the financial sector and the real economy in full swing, this is a time for conservatism in banking. The European Central Bank’s latest six-monthly financial stability review, however, suggests euro area banks have absorbed barely 60 per cent of losses estimated for 2007-2010. Eurozone banks could face cumulative total losses of $218bn on their securities and an additional $431bn of losses on their loan books, making a total of $649bn.
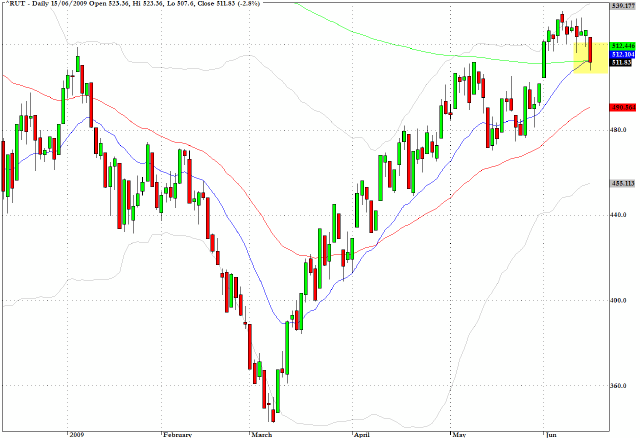
The Russell 2000 (RUT) which has been the beneficiary of those seeking out high beta stocks also managed to find support at a key level where the 20 and 200-day EMA’s intersected yesterday.
In yesterday’s commentary I discussed my concerns for the Brazilian Bovespa Index (BVSP) which was revealing some negative momentum divergences and the index, along with other emerging markets, gave back almost three percent in yesterday’s trading.
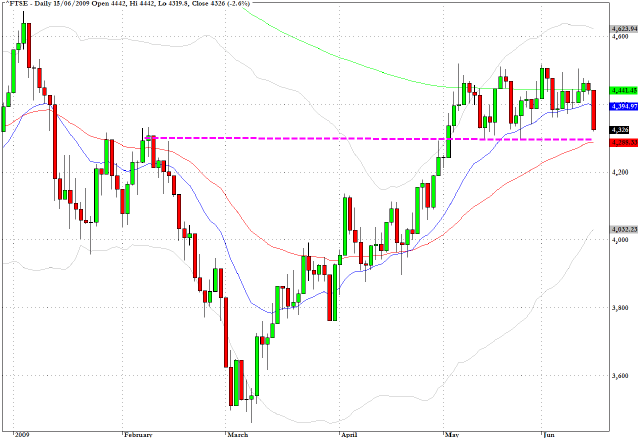
Another index which saw slightly more relative weakness than its US counterpart was the UK’s benchmark index, the FTSE, which came to rest at 4326 and will be looking at a retest of the 4280 level which is an area of chart support/resistance and also where the 50-day EMA is found.
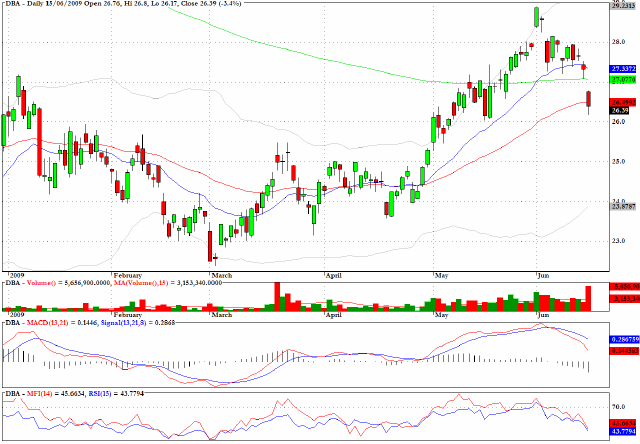
DBA, a sector fund which allows one to take a position on agricultural commodities, dropped by 3.4% on a substantial uptick in volume and fell through the 50-day EMA support level.
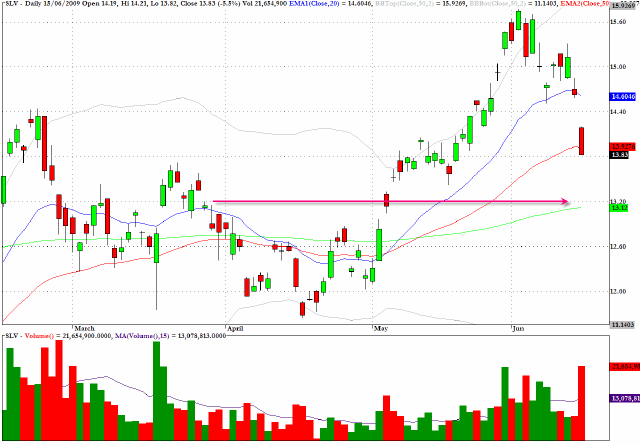
The chart for SLV, which is the exchange traded fund for silver, shows the sharp losses that have been seen since the recent move to multi-period high in early June.
There has been a setback to both of the key precious metals as the dollar has been showing strength and the sector rotation strategists seem to be less focused on spooking the bond market to extract higher yields now that there is a pause in the Treasury auction schedule. But the pauses will be relatively few and far between and I would expect silver and gold to be worthy of attention when those hedge funds specializing in the commodity re-inflation scenario decide to move aggressively again.
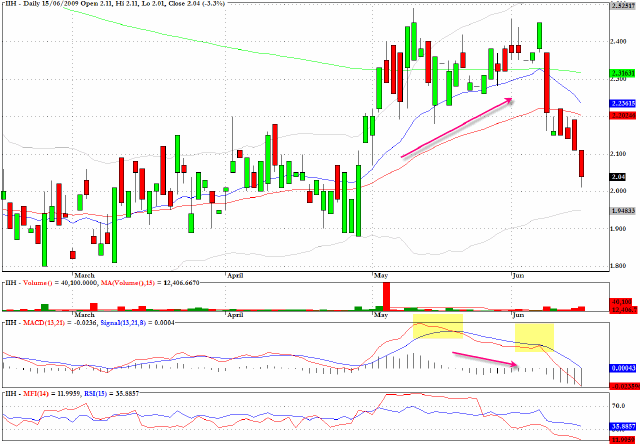
IIH reveals a classic MACD negative divergence pattern and has fallen sharply in the last few sessions.
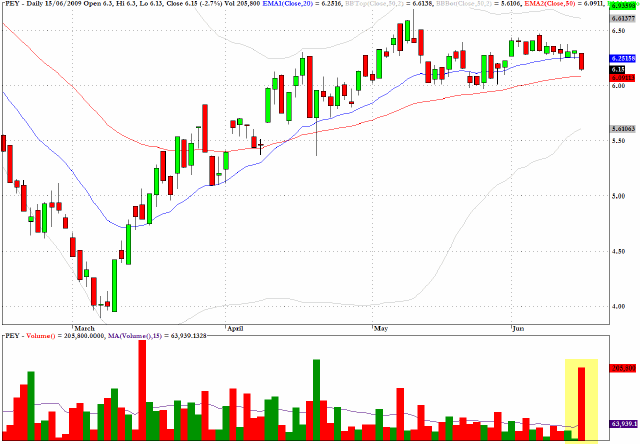
The chart for PEY, which tracks a basket of high dividend-yielding US stocks, shows an unusual spike in volume yesterday with more than three times the daily average being registered.
It is always worth monitoring unusual volume behavior in some of the more "off the beaten track" ETF’s.
Clive Corcoran is the publisher of TradeWithForm.com, which provides daily analysis and commentary on the US stock market.
|