| Corcoran Technical Trading Patterns For June 17 |
| By Clive Corcoran |
Published
06/17/2009
|
Stocks
|
Unrated
|
|
|
|
Corcoran Technical Trading Patterns For June 17
The US equity market is now moving into a zone where it needs to be rescued. In essence the charts below, many of which have been featured in this column over the last two weeks, are now poised at critical levels. With two days of selling behind us already this week, the most obvious conclusion to be drawn from the patterns below is that the sideways drift since mid May, and the declining volume during the rolling top phase, now appears to be giving way as sellers are stepping up to the plate.
In some ways the charts look too obviously in favor of the bears and there may be a short term relief rally from an oversold condition.
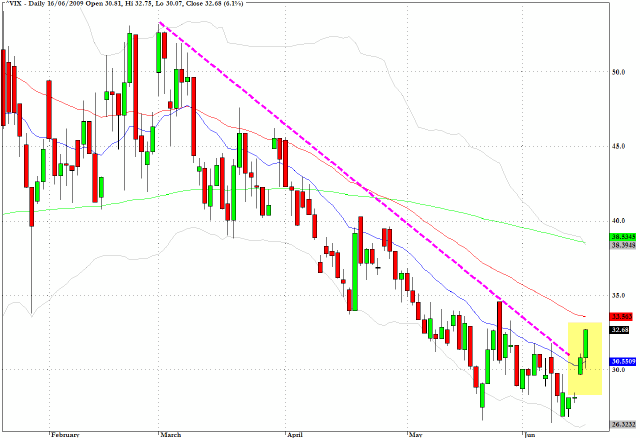
One chart in particular needs careful monitoring in coming sessions which is the VIX - the CBOE Volatility Index - which is now in the process of violating a downtrend line in place since March. This indicator is inversely correlated with the S&P 500 and suggests that the recent complacency and cheerfulness was getting way overdone.
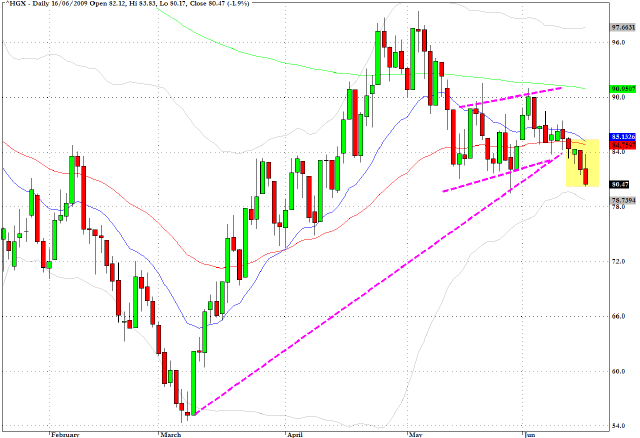
Featured last Thursday in my commentary were concerns about the housing sector. The Philadelphia Housing Index (HGX) is now revealing a breakdown pattern which does not portend well for the financial services sector which still has not resolved the toxic asset issues.
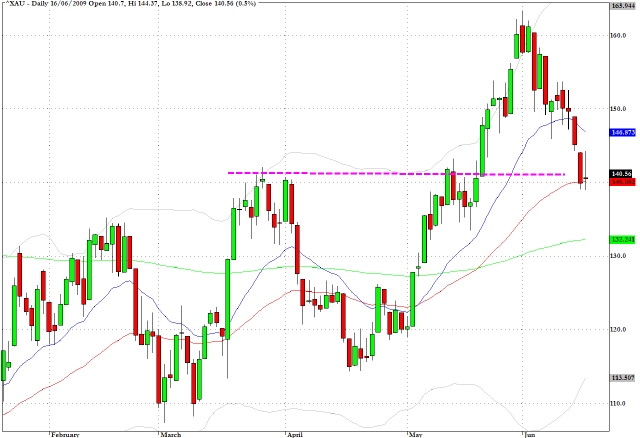
XAU, the Gold and Silver index, has also reached a critical support level. If there is renewed pressure on equities in general, rather than some technical trading limits being tested, this index could well retreat along with the rest of the market as happened during the rout last fall.
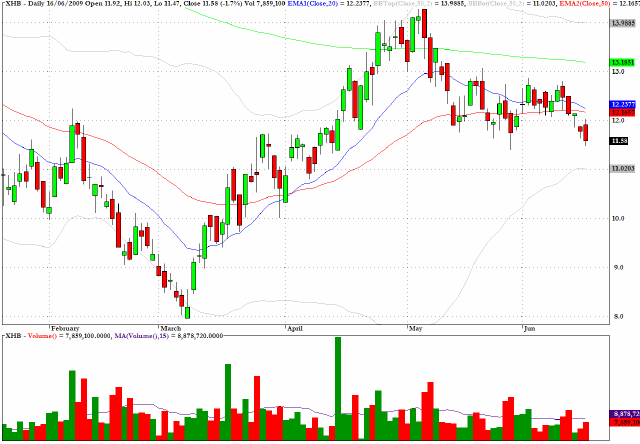
XHB, an exchange traded fund which tracks the homebuilding sector, and which I discussed here last week in the context of a break below the green cloud of the Ichimoku chart, also reveals a drop below all three moving averages and a violation of trendline support which echoes that seen for HGX.
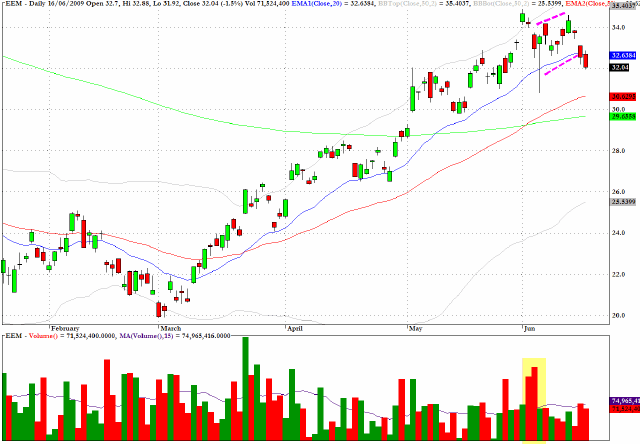
EEM, the sector fund which tracks the MSCI Emerging Markets Index, has broken down from the pullback pattern where it failed to reach back to the late May high and could easily retreat back to the 200-day EMA in the intermediate term.
As always, the views expressed in this column should not be taken as a specific recommendation for trades to be implemented in the upcoming session.
Here again are my comments from last week:
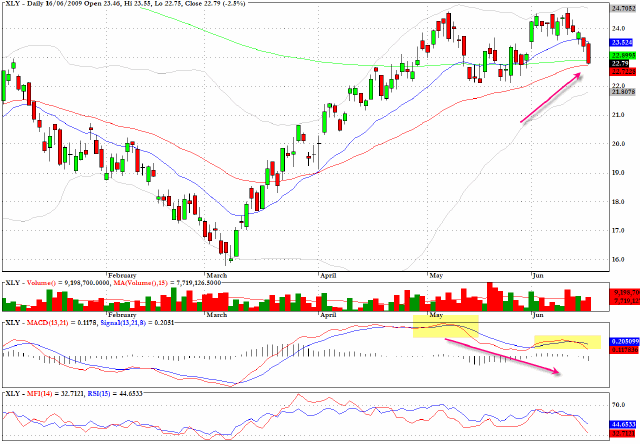
The consumer discretionary stocks, as tracked by XLY, are revealing some negative MACD divergences and also noteworthy is the pickup in volume associated with the inability to break above the high from early May.
Notably on this chart the fund closed yesterday’ session at a potential support level where the 50 and 200-day EMA’s have converged.
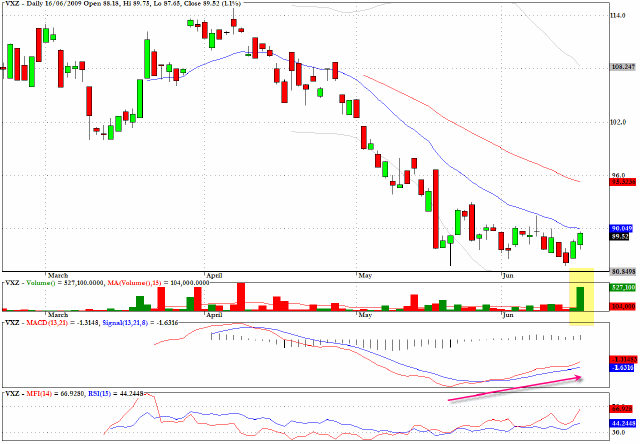
In conjunction with the chart for the VIX which begins today’s commentary, there is an ETF which allows one to profit from an uptick in volatility of the S&P 500 - VXZ.
Again comments from last week are worth repeating.
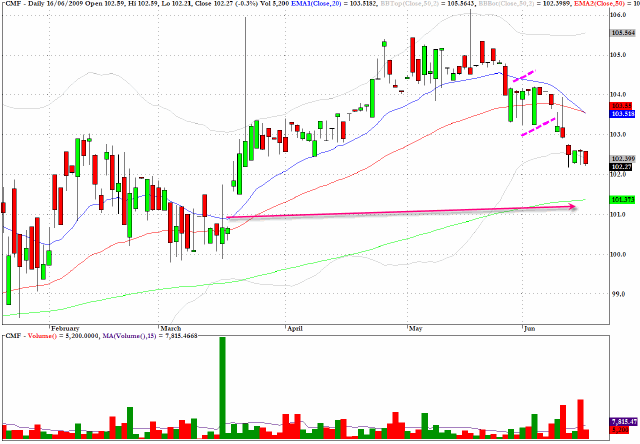
CMF is a fairly specialized exchange traded fund which tracks municipal debt for the state of California. After appearing to be unruffled by that state’s current calamitous budget situation, the last two days have seen selling emerge in this fund and the path looks clear for further downside pressure.
One of the featured charts from last Thursday was XRT, which is one of the exchange traded funds which tracks the US retail sector, and I expressed concerns about the technical formation.
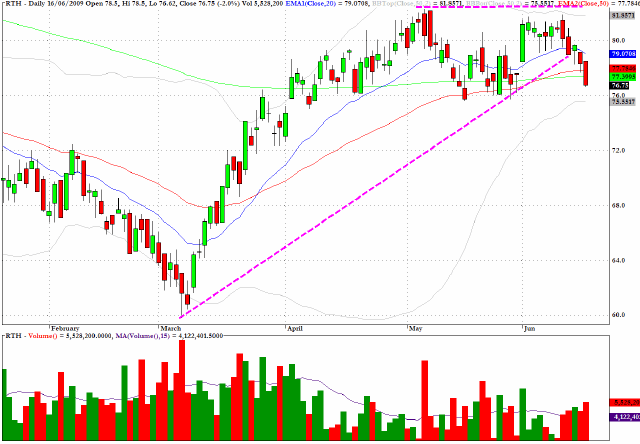
A related fund is RTH and the chart below is clearly displaying the MACD divergences and trendline violation which reinforces the view that these sectors need to be rescued soon as the pattern should be quite disconcerting to those who have been nibbling away on the long side in the last few weeks.
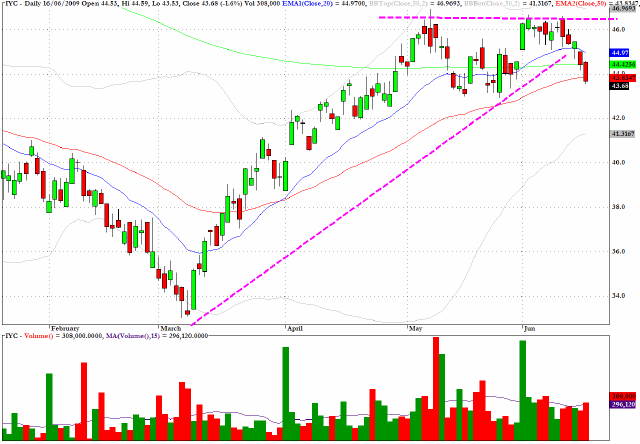
The chart for IYC, an exchange traded fund which track the Dow Jones US Consumer services sector, is revealing a very similar formation to that seen on the chart above for the retailing sector.
Clive Corcoran is the publisher of TradeWithForm.com, which provides daily analysis and commentary on the US stock market.
|